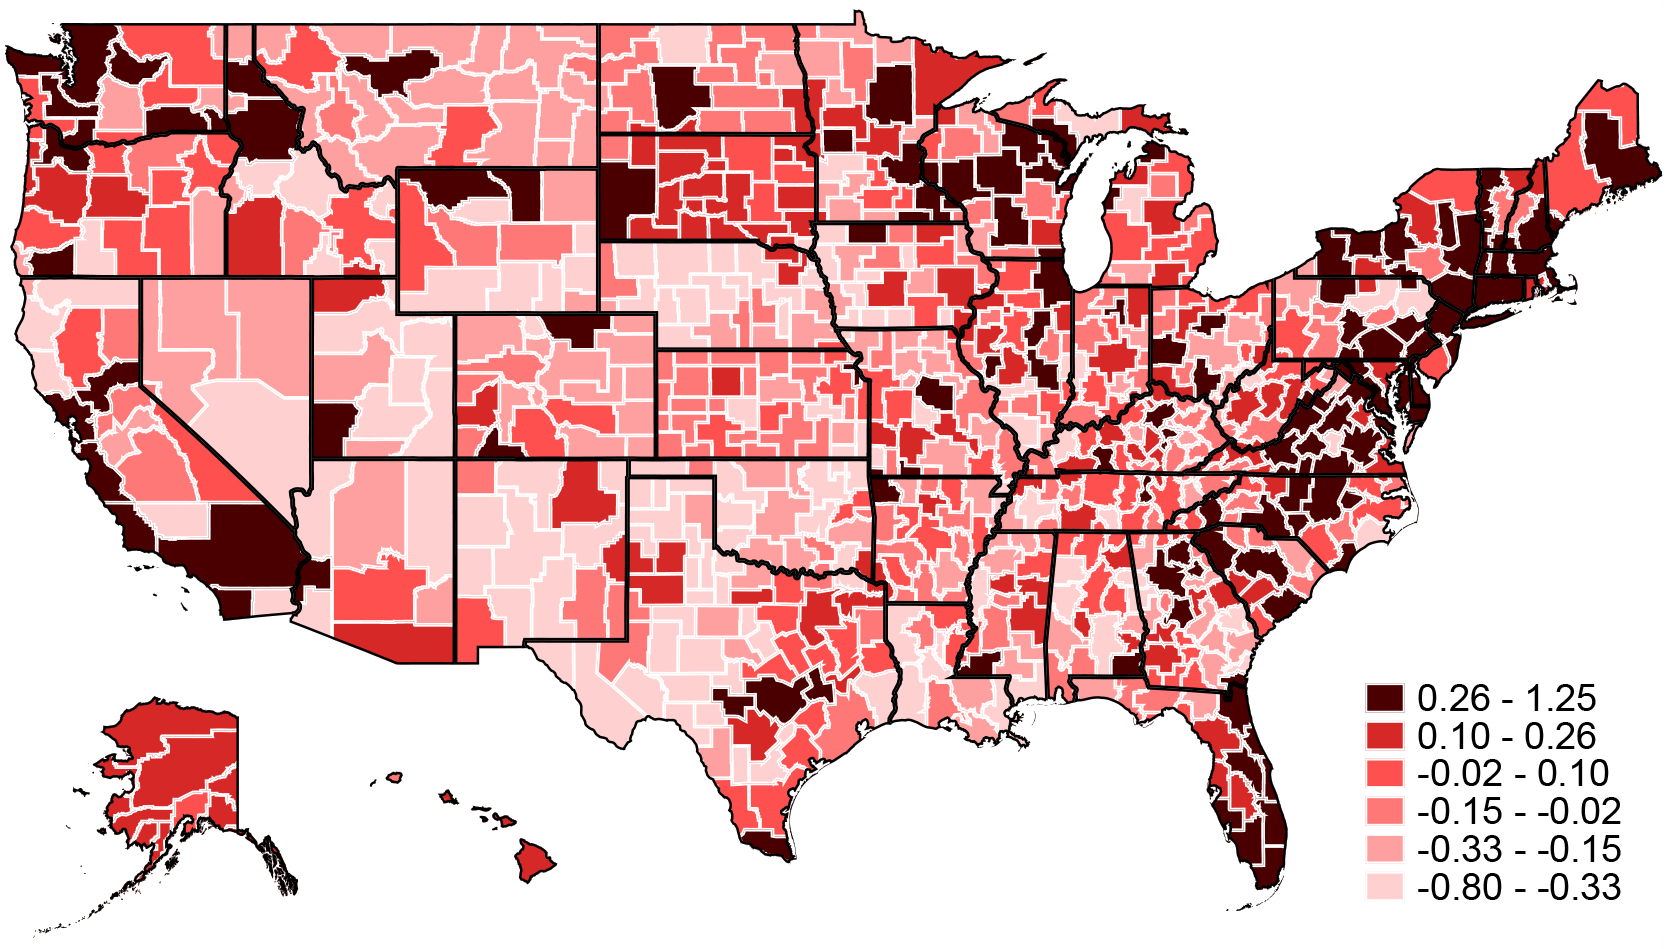
Figure 3:

Life Expectancy Treatment Effects
Notes: The map shows the Empirical Bayes-adjusted estimates of life-expectancy treatment effects . Note that small CZs have been aggregated within state (see Appendix Figure A.1) and a single life expectancy estimate is reported for each aggregate CZ.
