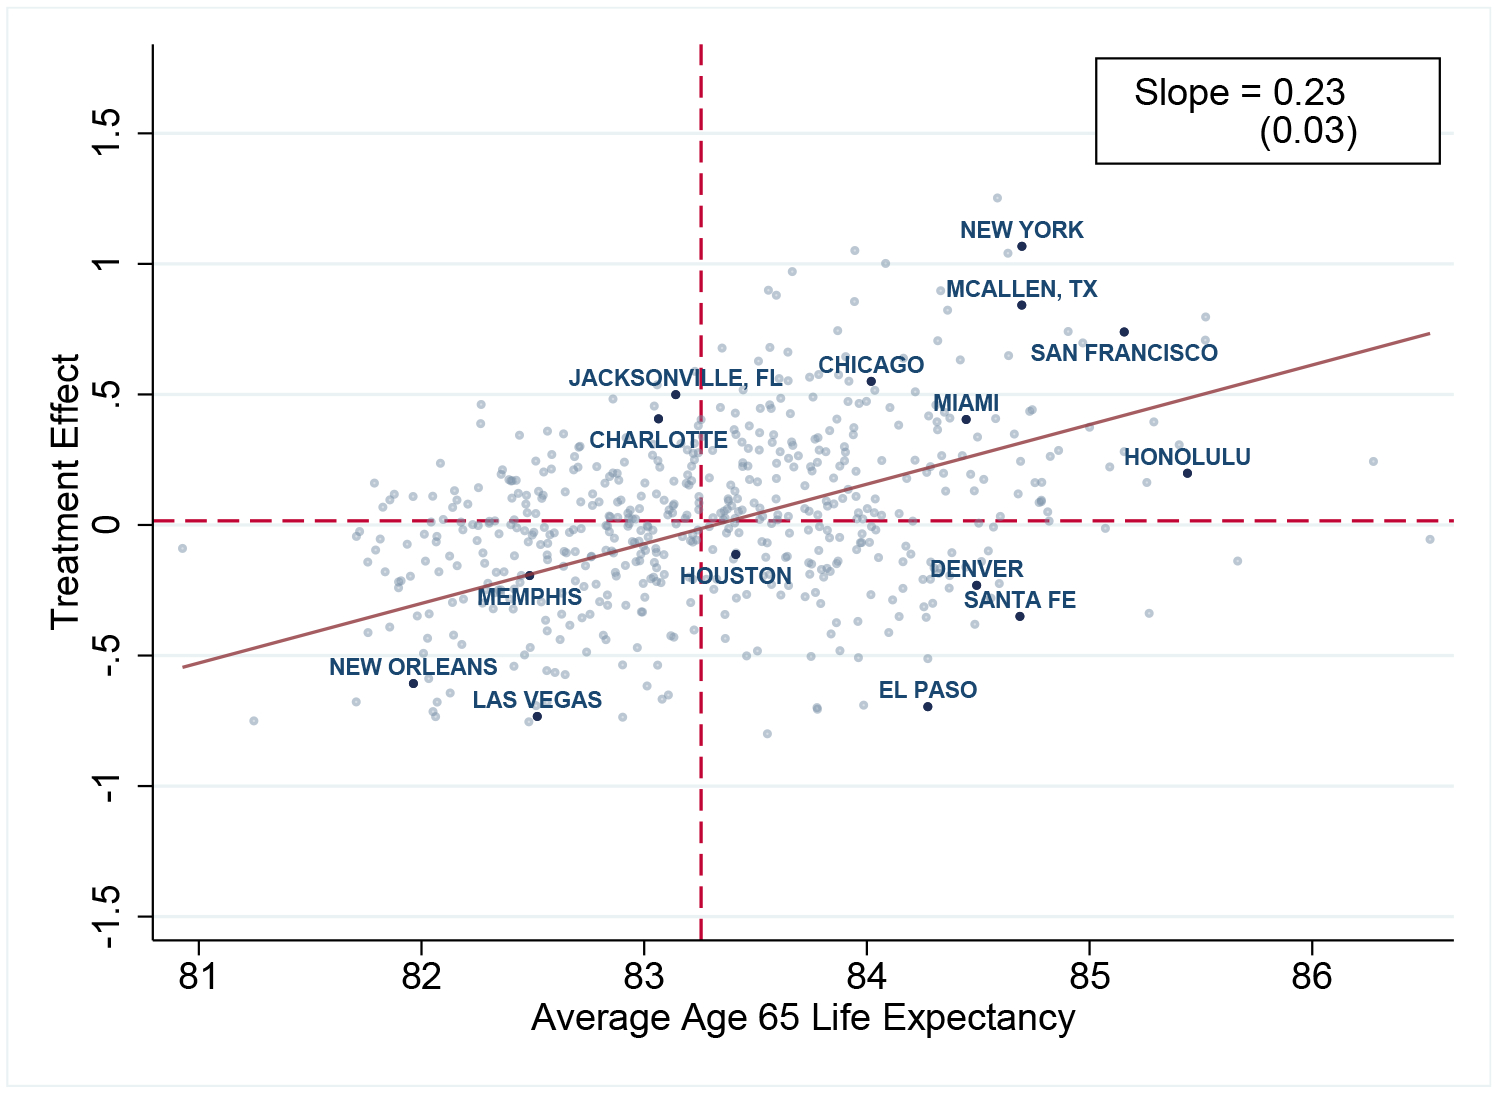
Figure 4:

Life Expectancy Treatment Effects vs. Life Expectancy
Notes: The plot shows a scatterplot of the Empirical Bayes (EB)-adjusted age 65 life-expectancy treatment effects for CZ j on the average age 65 non-mover life expectancy (Lj). The line of best fit comes from a regression of non-EB-adjusted treatment effects on average non-mover life expectancy. The horizontal and vertical dashed lines show the medians of treatment effects and life expectancy, respectively, over all CZs. Confidence intervals for the treatment effects and life expectancies of all CZs are provided online.
