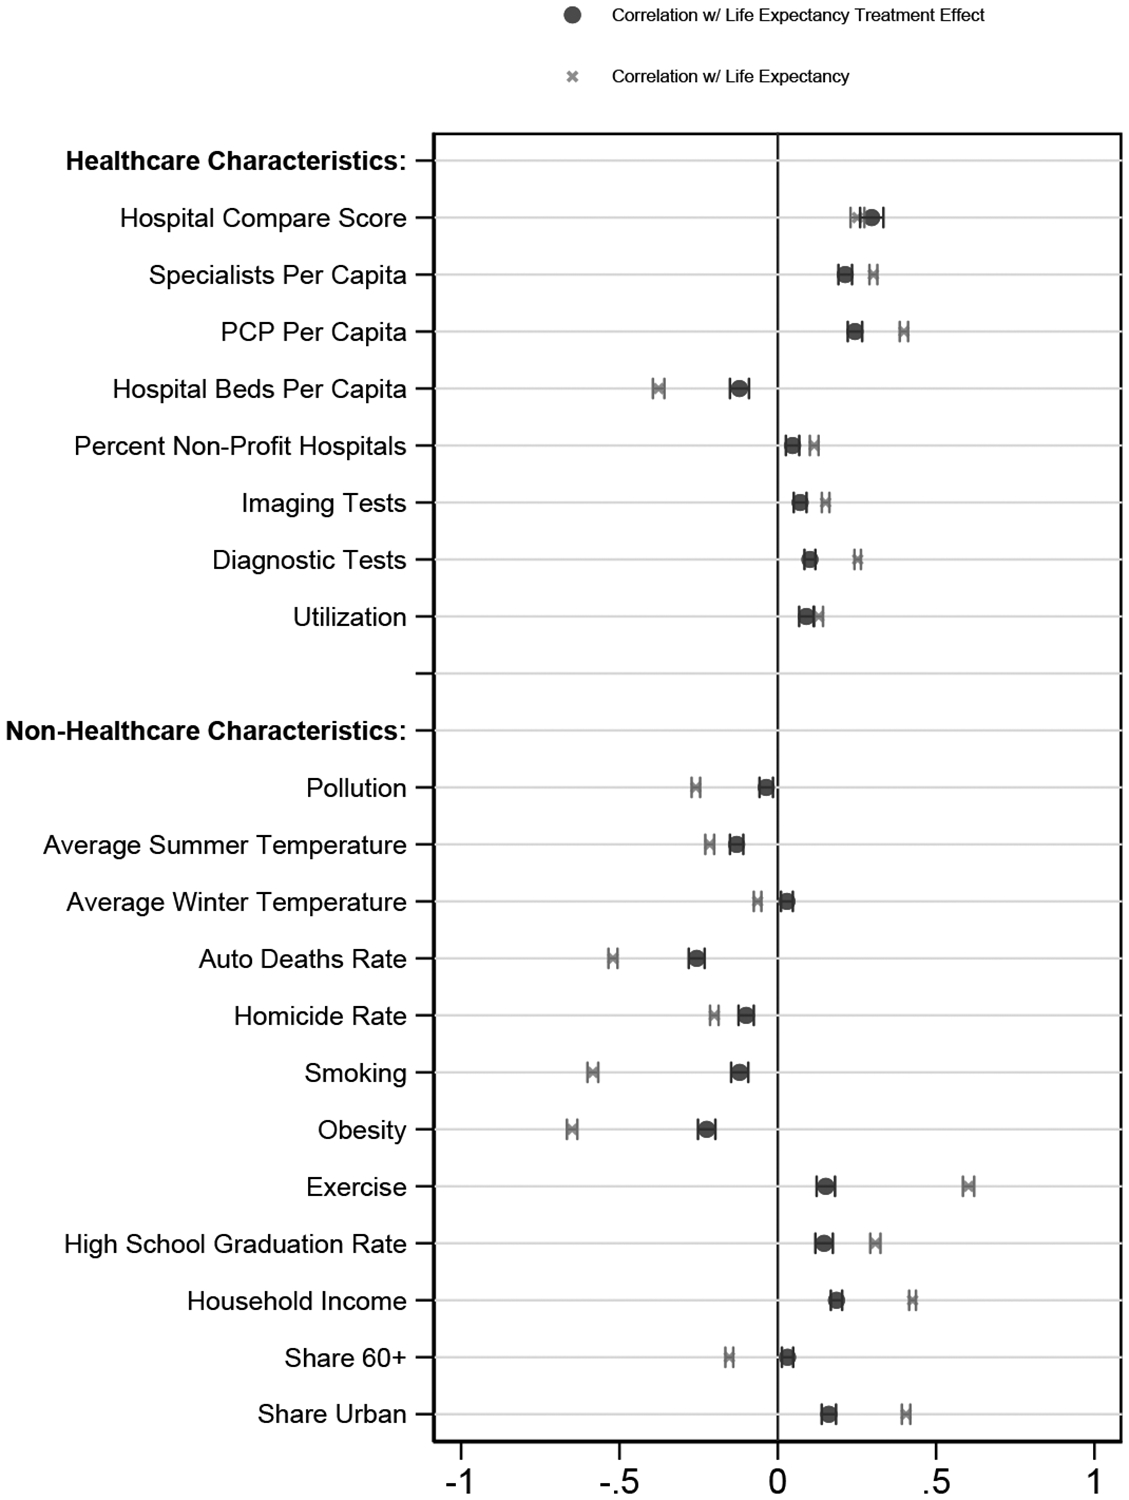
Figure 6:

Correlations with Place Characteristics
Notes: The dots in this panel report bivariate variance-weighted least squares regression results of our life expectancy treatment effects on z-scores of the indicated place characteristic; Appendix D provides more detail on their definitions. The x marks report bivariate variance-weighted least squares regression results of our age 65 life-expectancy estimates (Lj) on z-scores of the indicated place characteristic. All regressions are at the CZ level, and the regressions are weighted by the inverse variance of each measure. 95% confidence intervals are based on standard errors from the regressions. In this figure, the sample for each bivariate regression is all CZs for which that place characteristic is defined (see Appendix Table A.11 column 3), although the results are nearly identical if we instead use the 554 CZs for which every place characteristic (except homicide rates) is defined.
