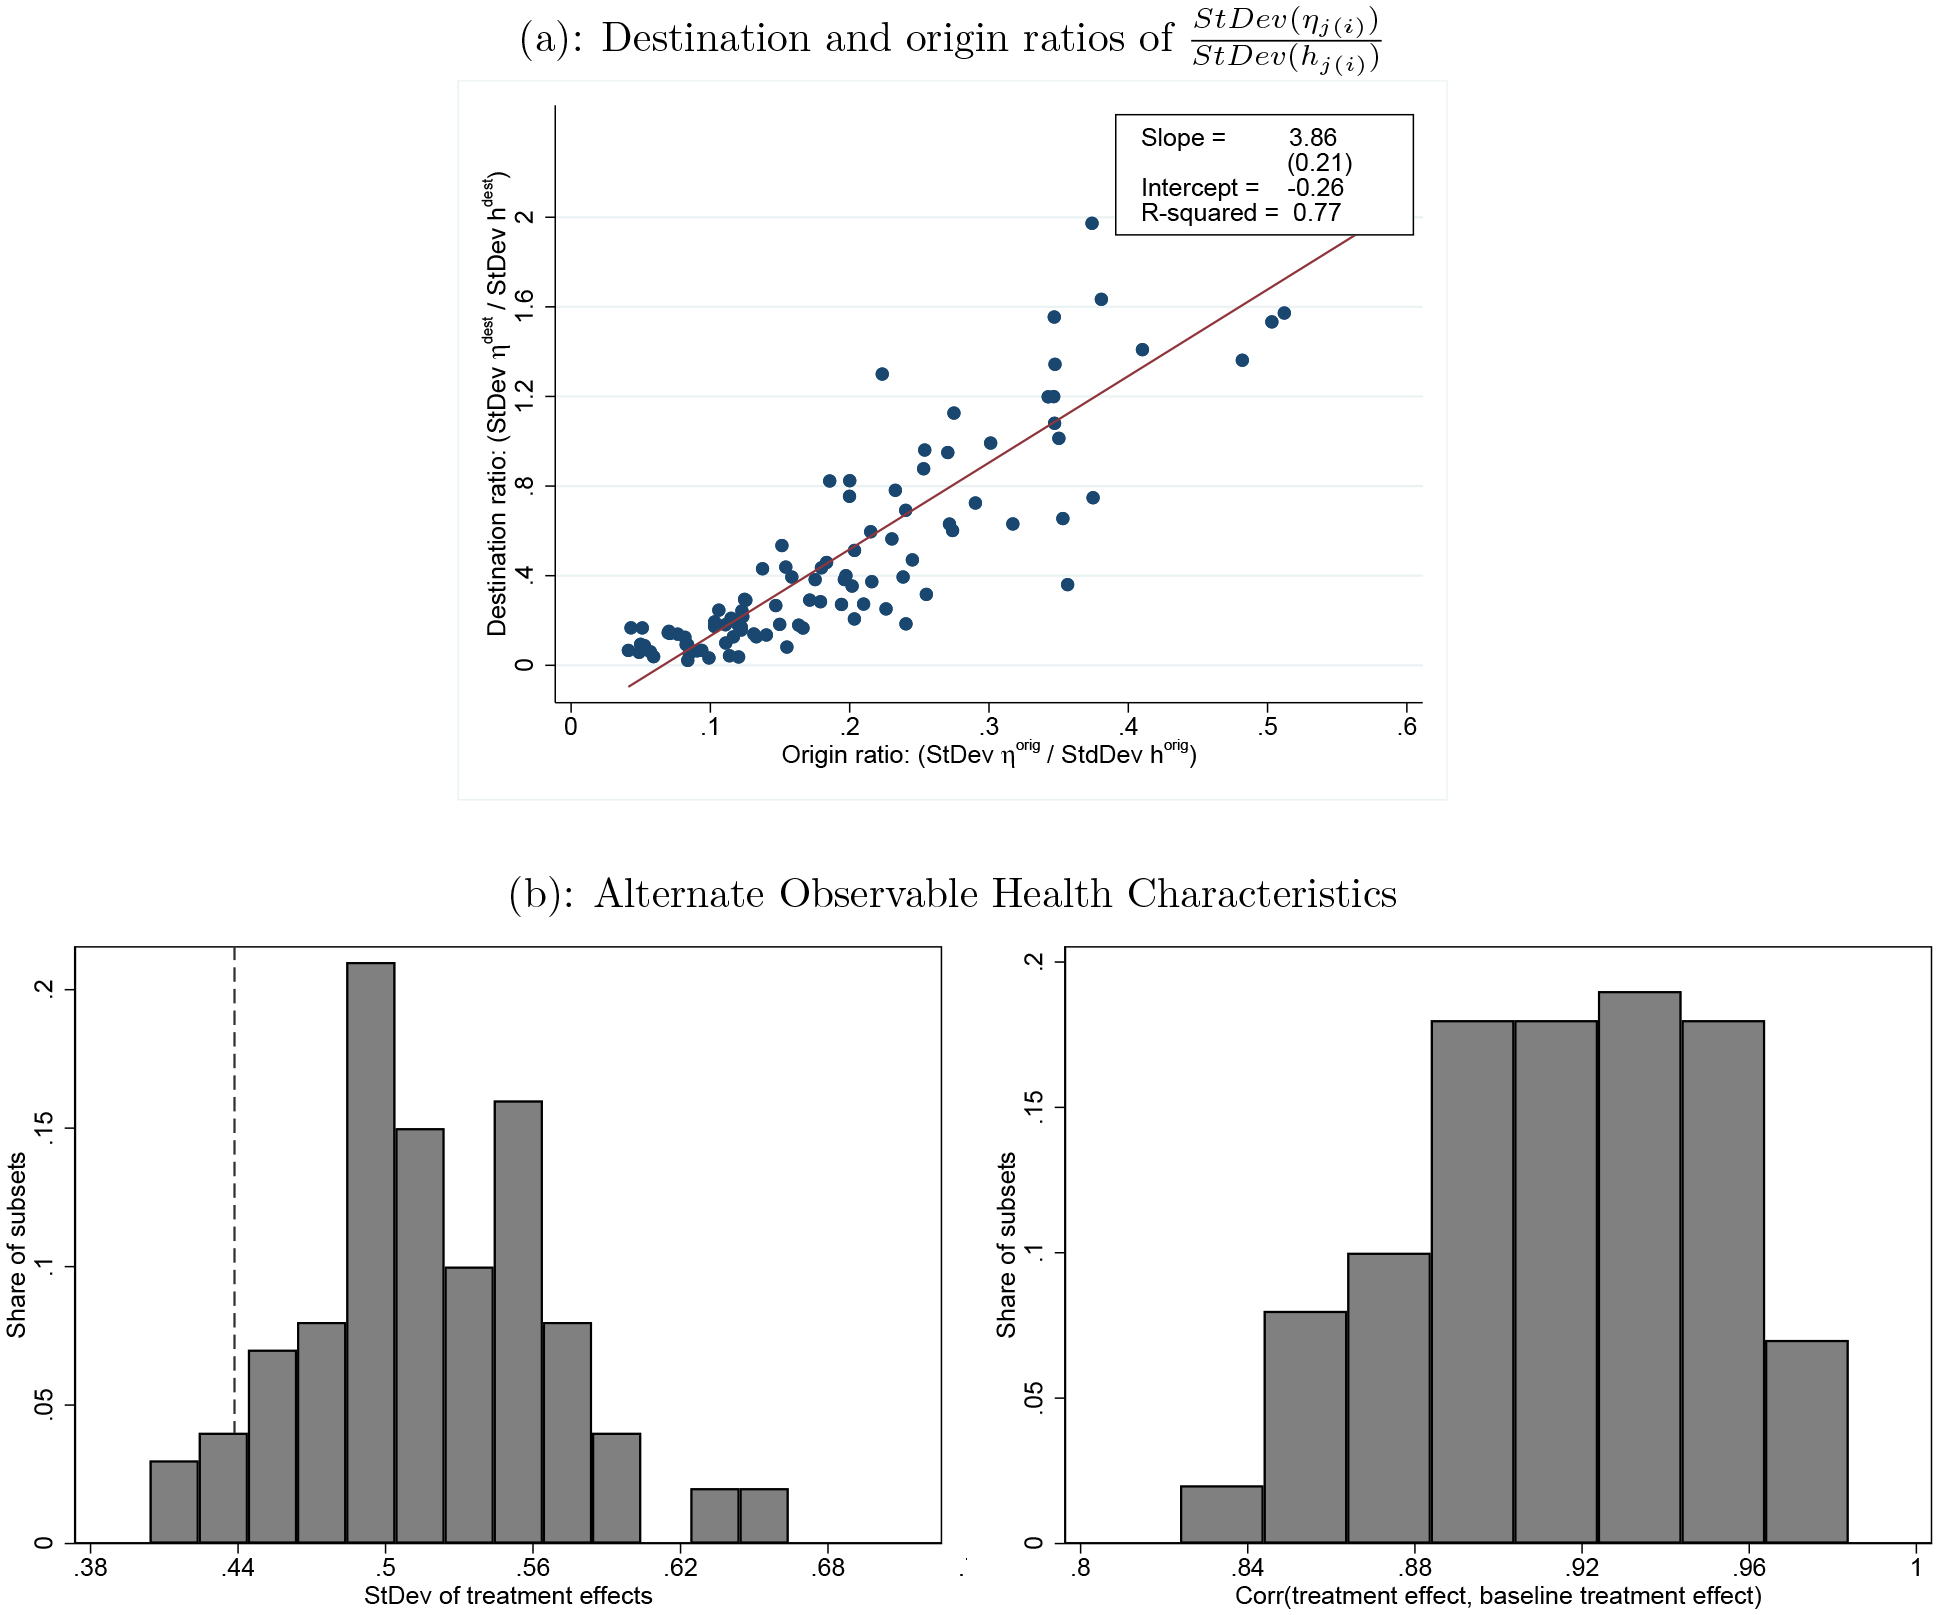
Figure 7:

Support for Selection-Correction Assumptions
Notes: Panel (a) plots against for 100 different subsets ; each point in the scatter plot represents a different definition of k. For each k, Hi includes log(overall utilization) and a random subset of 13 of the 27 chronic conditions. Panel (b) reports various summary statistics about the treatment effects produced by each of the 100 different definitions of k in panel (a). The left figure in panel (b) plots the standard deviation across CZs of the treatment effects from each of these alternate specifications; the dotted line shows the standard deviation across CZs of the treatment effects in the baseline specification (Table 4). All standard deviations are computed using the split-sample approach. The right figure in panel (b) plots the correlation of the treatment effects in each of the alternate specifications with the baseline treatment effects.
