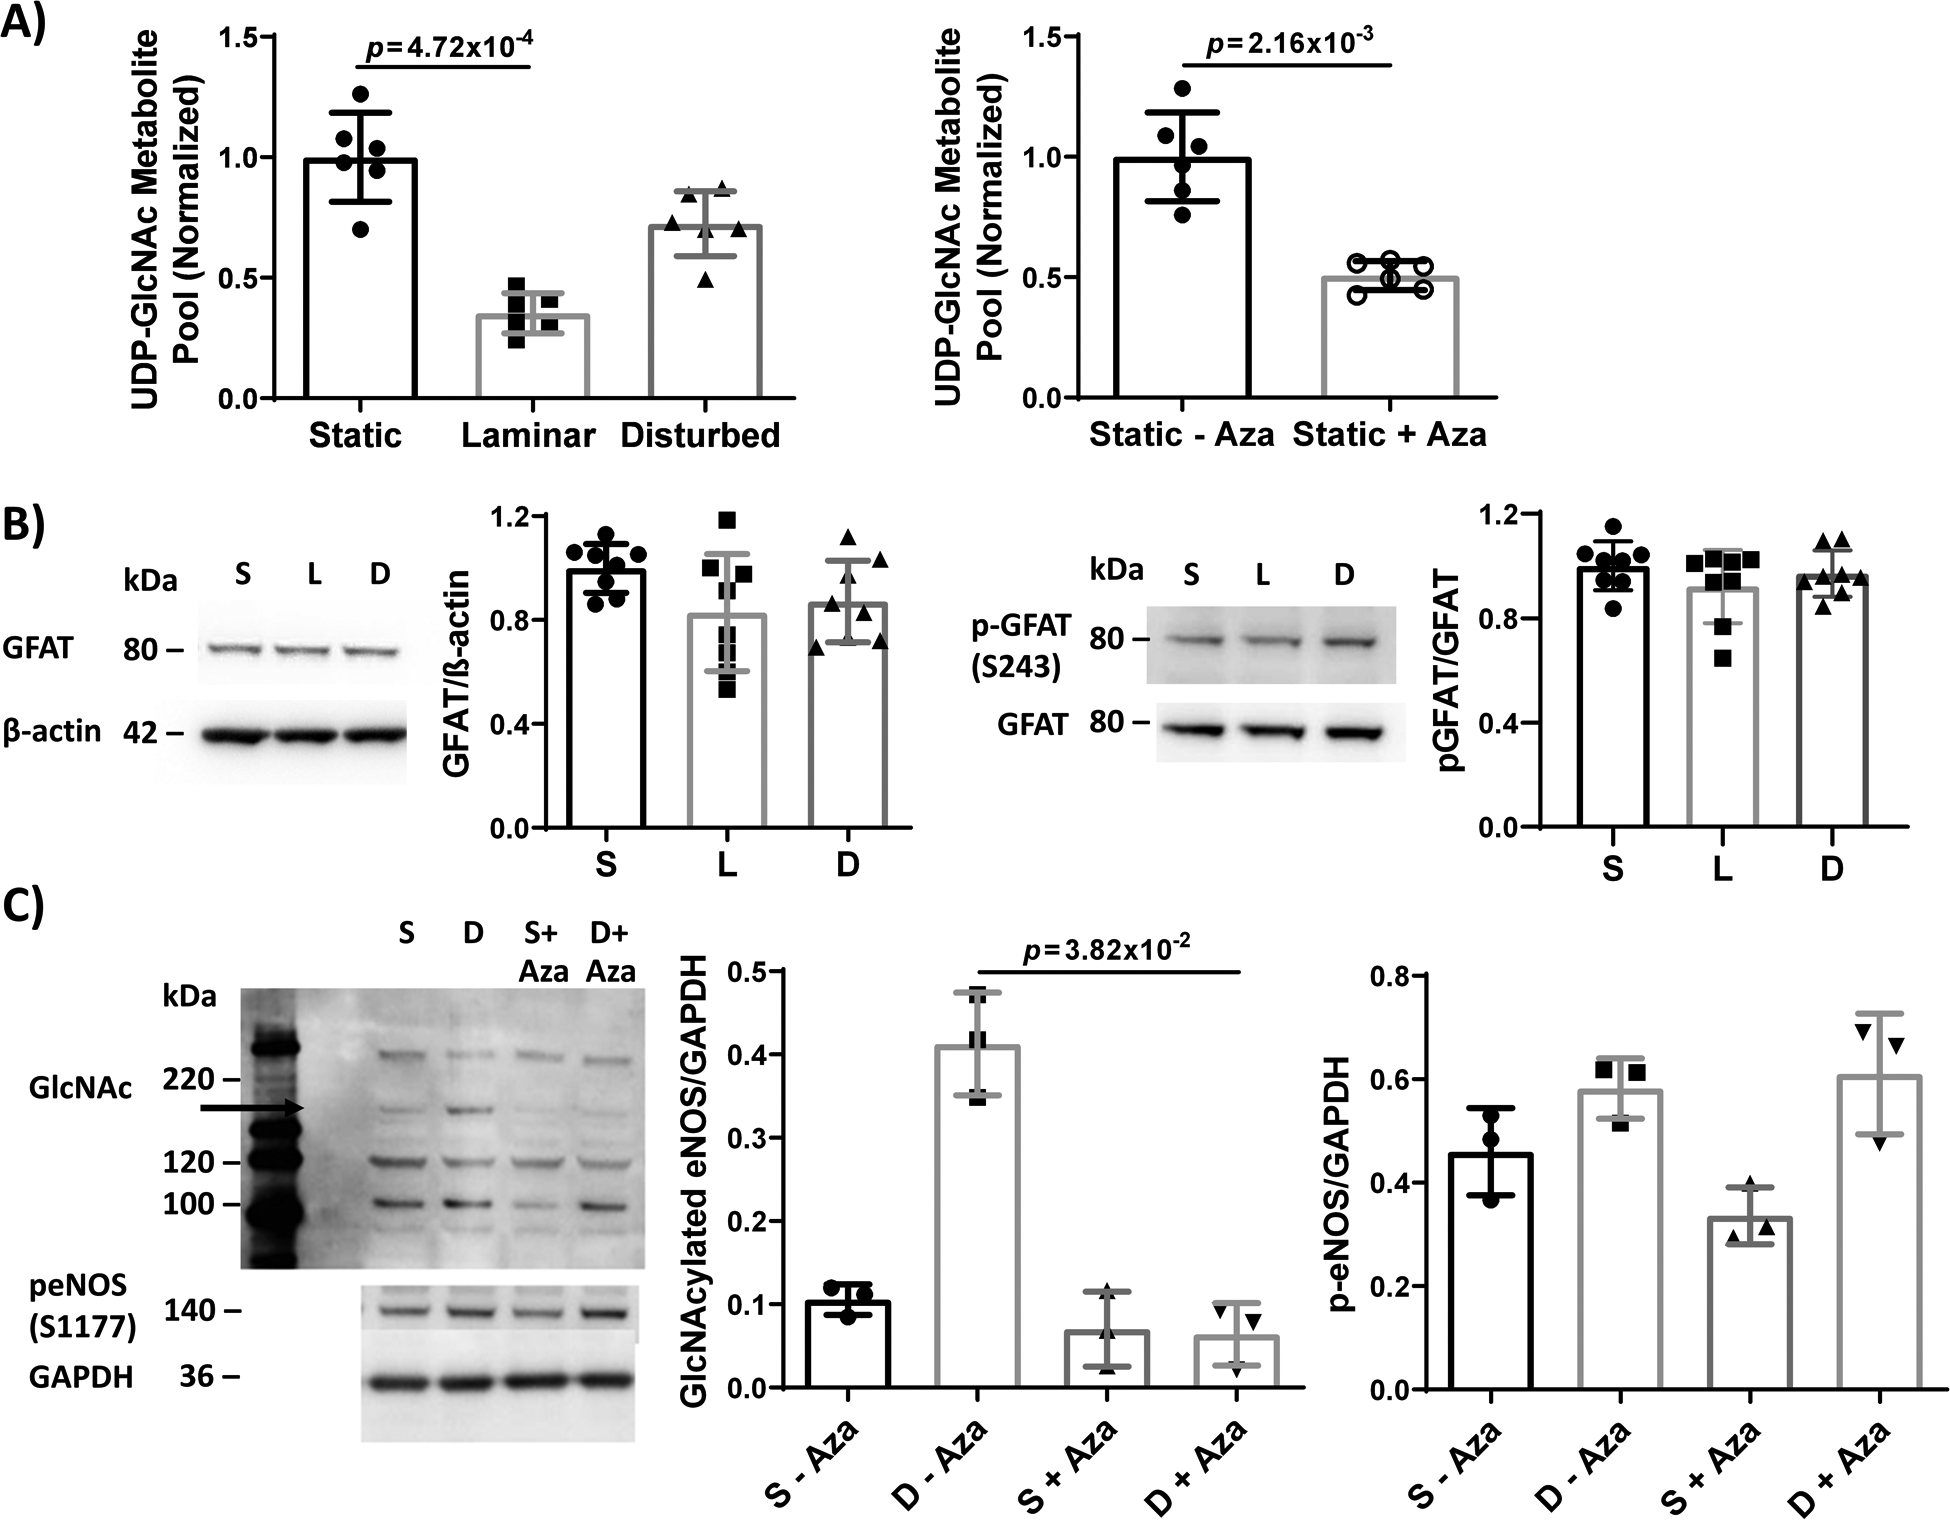
Figure 4: HBP flux and UDP-GlcNAc substrate decreased in HUVEC exposed to steady laminar flow without a change in GFAT. GFAT inhibition decreased UDP-GlcNAc, and in cells exposed to disturbed flow, decreased eNOS O-GlcNAcylation and increased eNOS phosphorylation.

(A) UDP-GlcNAc total metabolite pool measured by mass spectrometry in HUVEC exposed to 24 hours static culture, steady laminar, or oscillating disturbed flow or HUVEC exposed to 24 hours static culture with and without 1 μM azaserine (+/− Aza, GFAT inhibitor). Total pool was normalized to the average pool size for static, untreated cells. n = 6 samples per condition. For flow conditions, p = 9.79×10⁻⁶ by Kruskal-Wallis test, with p value on the figure determined by Dunn’s multiple comparisons test. For azaserine treatment, p value on the figure determined by Mann-Whitney test. (B) Western blot and quantification of GFAT and p-GFAT (S243) in HUVECs exposed to 24 hours static culture, steady laminar, or oscillating disturbed flow. n = 8 samples, normalized to static cultured and βactin or GFAT. p = 1.26×10⁻¹ (GFAT) and p = 4.70×10⁻¹ (p-GFAT) by Kruskal-Wallis test. (C) Western blot and quantification of protein O-GlcNAcylation and p-eNOS in HUVECs exposed to static culture (‘S’) or 24 hours oscillating disturbed flow (‘D’) with and without 1 μM azaserine (+/− Aza, GFAT inhibitor). n = 3 samples. p = 2.34×10⁻² (GlcNAc eNOS) and p = 3.39×10⁻² (p-eNOS) by Kruskal-Wallis test, with p values on the figure determined by Dunn’s multiple comparisons test.
