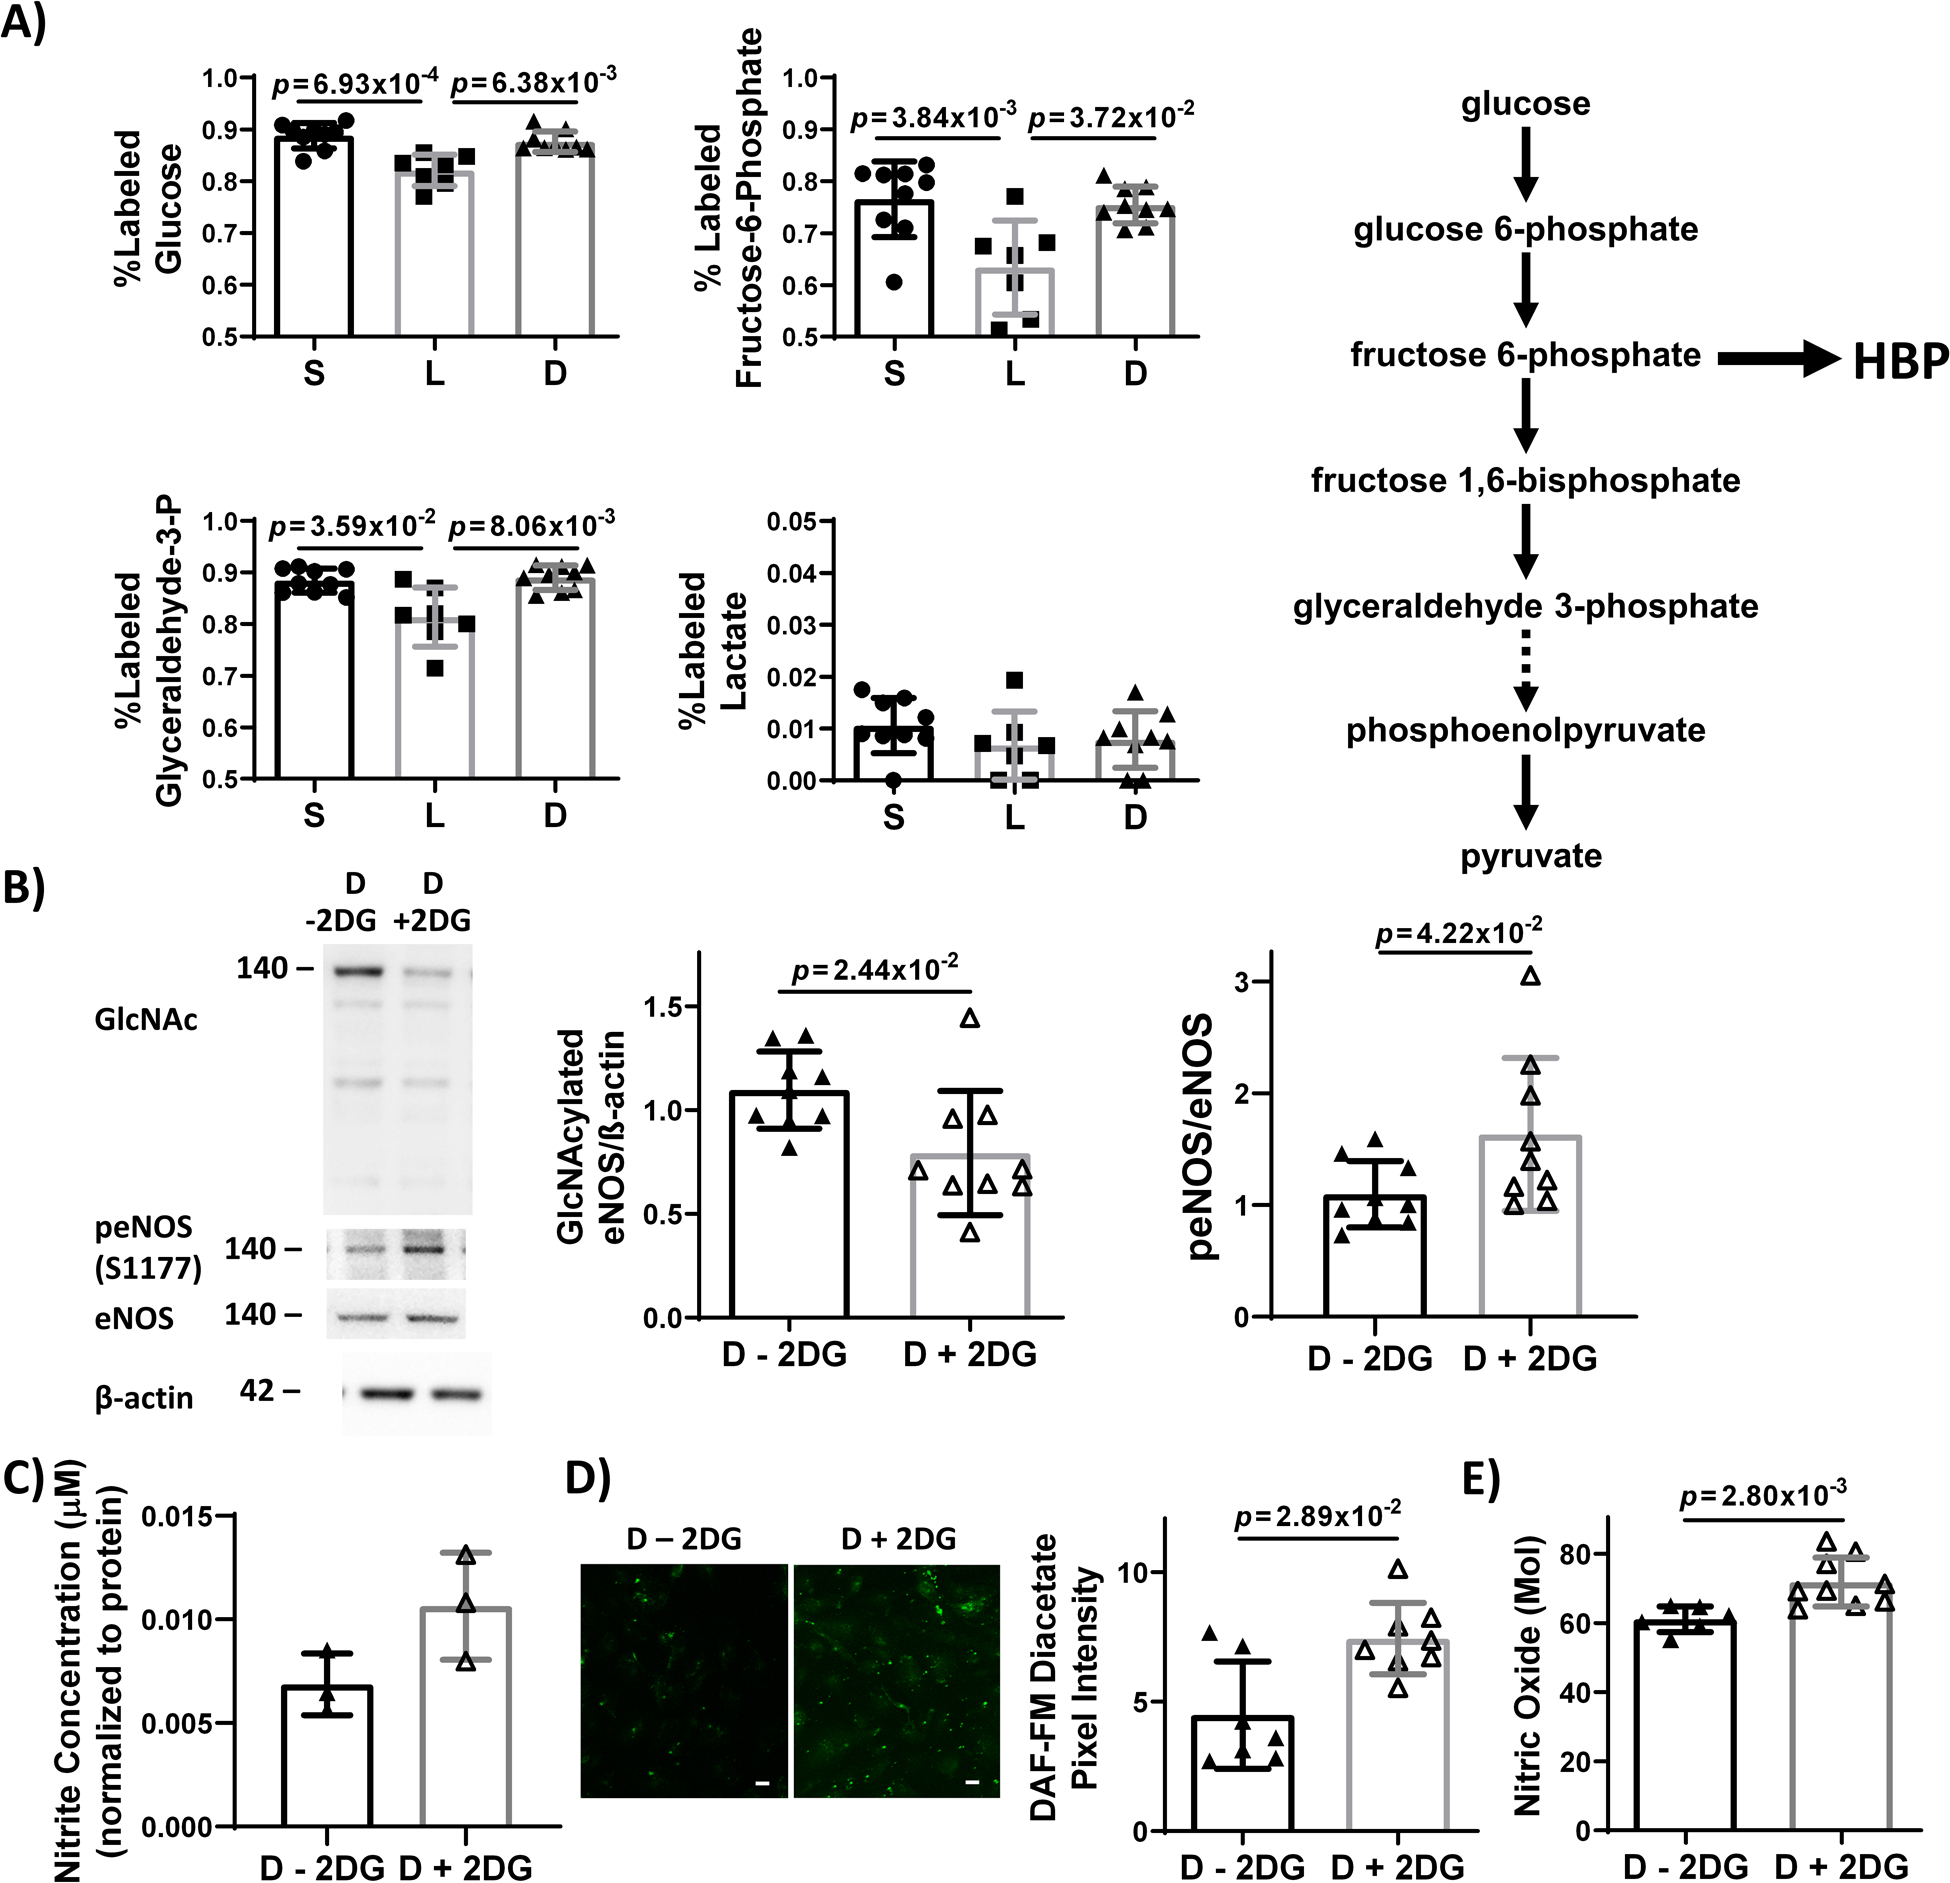
Figure 5: Glycolytic flux decreased in EC exposed to steady laminar flow as compared to static culture and oscillating disturbed flow. Inhibiting glycolysis via 2-DG in EC exposed to oscillating disturbed flow decreased eNOS O-GlcNAcylation and subsequently increased eNOS phosphorylation and NO.

(A) % labeled intracellular glycolytic intermediates (glucose, fructose-6-phosphate, glyceraldehyde-3-phosphate, and lactate) measured by mass spectrometry in HUVEC exposed to 24 hours static culture (‘S’), steady laminar (‘L’), or oscillating disturbed flow (‘D’) followed by 13C-glucose for 2 minutes. A simplified glycolysis pathway is depicted showing glucose metabolized to pyruvate, which is then converted to lactate. The hexosamine biosynthetic pathway (HBP) branches off glycolysis at fructose-6-phosphate. n = 9 samples, normalized to static culture and βactin or eNOS. p = 8.75×10⁻⁴ (glucose), p = 6.19×10⁻³ (fructose-6-phosphate), and p = 1.06×10⁻² (glyceraldehyde-3-phosphate) by Kruskal-Wallis test, with p values on the figure determined by Dunn’s multiple comparisons test. (B) Western blot and quantification of eNOS O-GlcNAcylation and p-eNOS in HUVECs exposed to 24 hours oscillating disturbed flow +/− 1 μM 2-DG. n = 9 samples. Statistical significance determined by Mann-Whitney test. (C) NO levels, measured via Griess Assay, in HUVEC exposed to 24 hours oscillating disturbed flow +/− 1 μM 2-DG. n = 3 samples per experiment. 1 representative experiment shown of 3 total experiments. (D) DAF-FM diacetate fluorescent images (green) and quantification of intracellular NO in HUVEC exposed to 24 hours oscillating disturbed flow +/− 1 μM 2-DG. Scale bar = 20 μm. n = 7 samples. 1 representative experiment shown of 2 total experiments. Statistical significance determined by Mann-Whitney test. E) Zysense NO analyzer quantification of NO in the conditioned media from HUVEC exposed to 24 hours oscillating disturbed flow +/− 1 μM 2-DG. n = 6 samples 1 representative experiment shown of 2 total experiments. Statistical significance determined by Mann-Whitney test.
