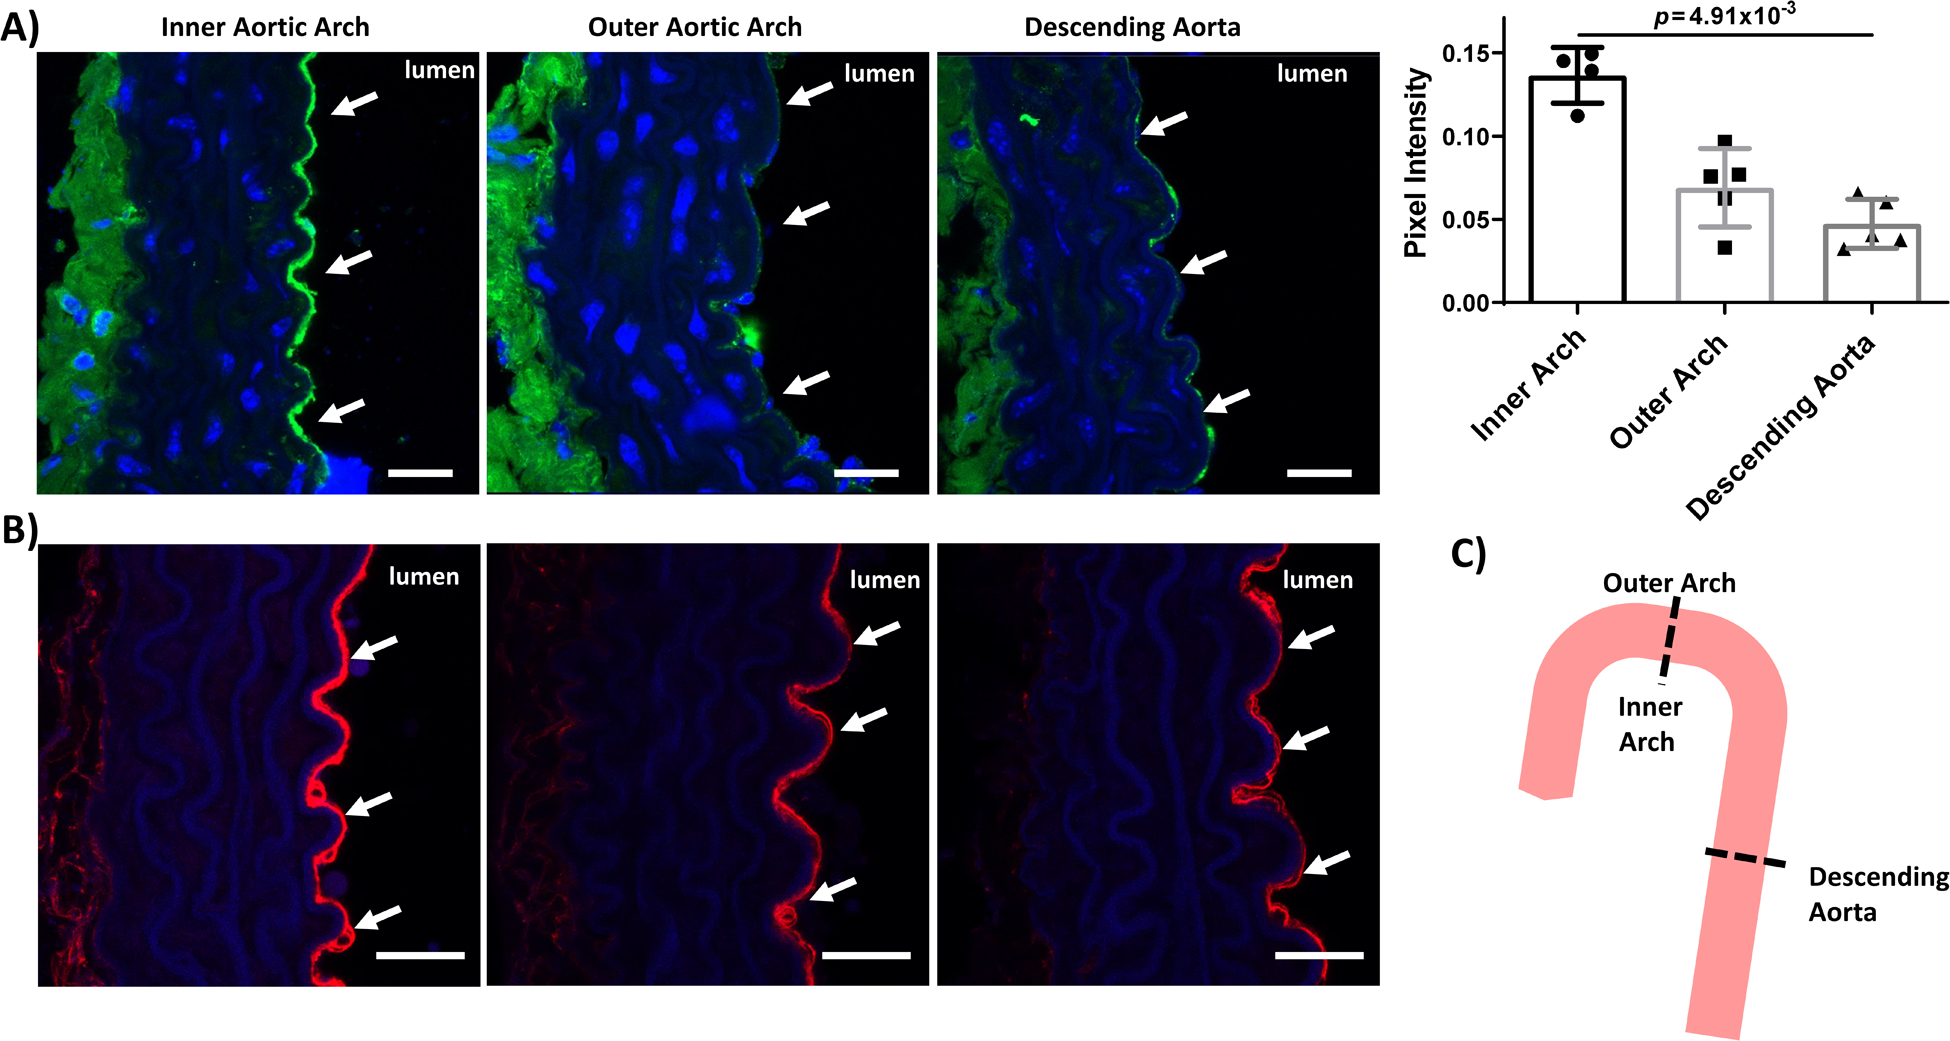
Figure 6: Endothelium in the inner aortic arch showed increased protein O-GlcNAcylation as compared to endothelial cells in the outer aortic arch and descending aorta.

Confocal microscopy images of inner and outer aortic arch and descending aorta cross sections from 2-month-old male C57BL/6J mice labeled for (A) O-GlcNAcylated proteins (green) and (B) ICAM-1 (red). Blue = nuclei. Scale bar = 20 μm. White arrows highlight the endothelium. Also shown is quantification of green pixel intensity in the endothelium. n = 4–5 samples. p = 1.60×10⁻³ by Kruskal-Wallis test, with p value on the figure determined by Dunn’s multiple comparisons test (all samples compared to inner arch).(C) Schematic of mouse aorta cross-sections. Outer aortic arch and descending aorta endothelium are exposed to laminar flow whereas inner aortic arch endothelium is exposed to disturbed flow.
