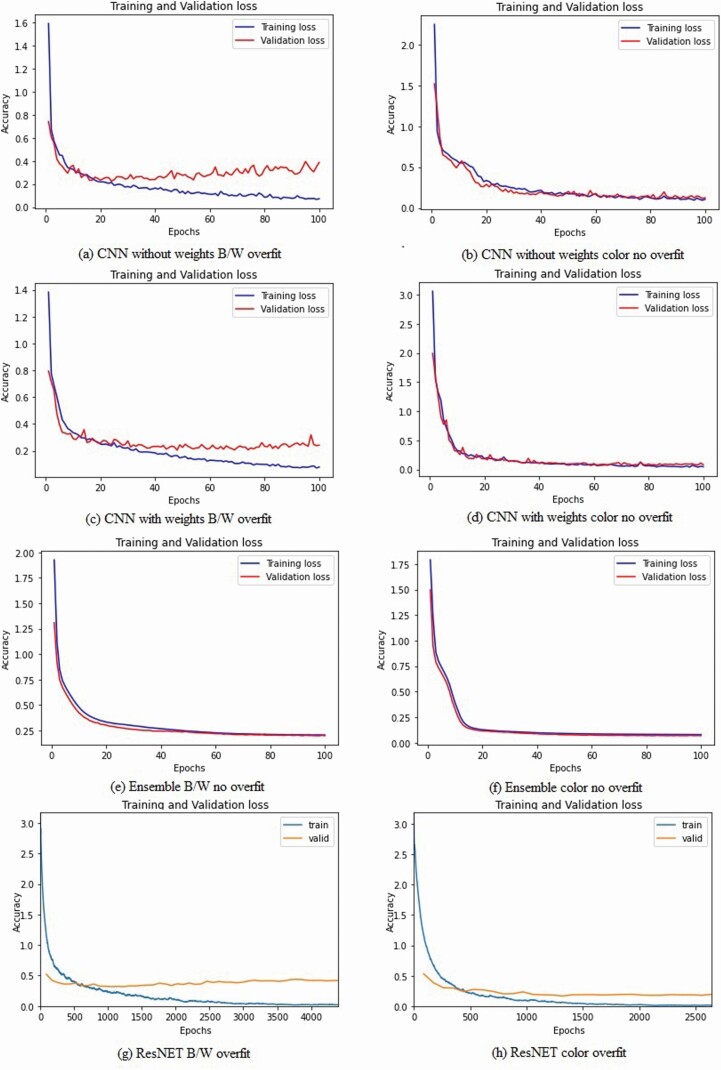
Figure 7.
Training and Validation Loss Graphs: (a), (c), (g), and (h) show the overfitting as there is a significant difference between the train and the valid curves. In (b), (d), (e), and (f), there is no overfitting as the two lines are almost overlapping showing very minimal or no differences between train and valid results. Abbreviations: CNN, convolutional neural network; ResNET, residual network.

