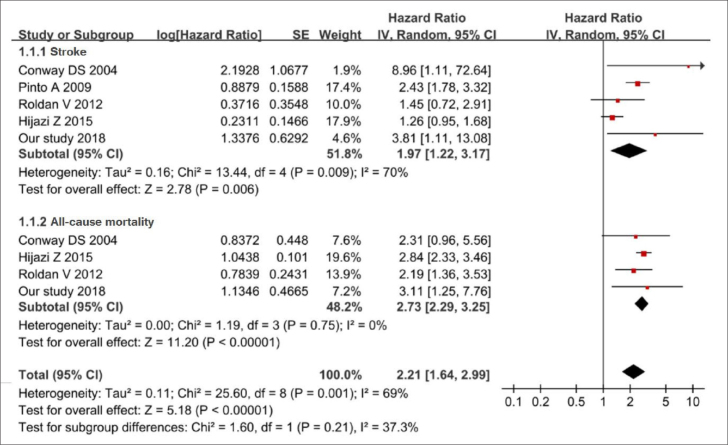
Figure 4.
Forest plot of the relationship between the interleukin-6 level and outcomes. The squares and horizontal lines represent the hazards ratio (HR) and 95% confidence interval (CI), respectively. The area of the squares reflects the weight of each study. The diamond represents the pooled HR and 95% CI

