
Extended Data Fig. 2. The RGG domains weakly interact with the SYGQ LC.
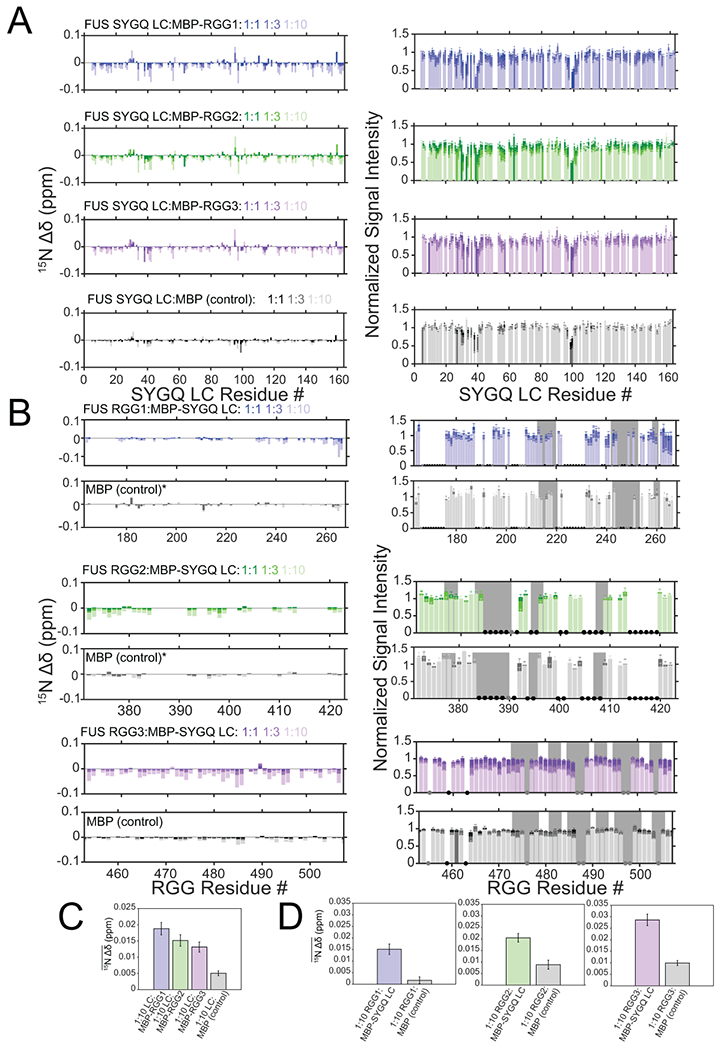
A) 15N chemical shift perturbations and intensity differences of the SYGQ LC in the presence of increasing concentrations of MBP-RGG1, MBP-RGG2, MBP-RGG3 or MBP alone (negative control). Intensity data are normalized to a SYGQ LC alone control and are plotted as mean mean ± s.d. of baseline noise for each spectrum as estimate of uncertainty in one representative data set out of two independent experiments. B) 15N chemical shift perturbations and intensity differences of RGG1, RGG2, or RGG3 with increasing concentrations of MBP-SYGQ LC. The data are relative to RGG1, RGG2 or RGG3 alone controls. The asterisks for the RGG1 and RGG2 titrations with MBP indicate where the data are normalized to the 1:1 condition. Gray bars represent RGG motifs. Black dots correspond to resonances that are unassigned, while gray dots represent resonances that are assigned but not resolved due to overlap. Intensity data are plotted as mean ± s.d. of baseline noise for each spectrum as estimate of uncertainty in one representative data set. C) Average 15N chemical shift perturbations across all positions in SYGQ LC in the presence of ten times excess MBP-RGG1, MBP-RGG2, MBP-RGG3 or MBP alone (negative control) (full data points presented in A). Data are plotted as mean ± s.e.m. in one representative data set out of two independent experiments. D) Average 15N chemical shift perturbations across all positions in RGG1, RGG2 or RGG3 in the presence of ten times excess MBP-SYGQ LC or MBP alone (negative control) (full data points presented in B). Data are plotted as mean ± s.e.m. in one representative data set out of two independent experiments.