
Extended Data Fig. 5. NOEs within a two-component condensed phase containing FUS SYGQ LC and RGG3.
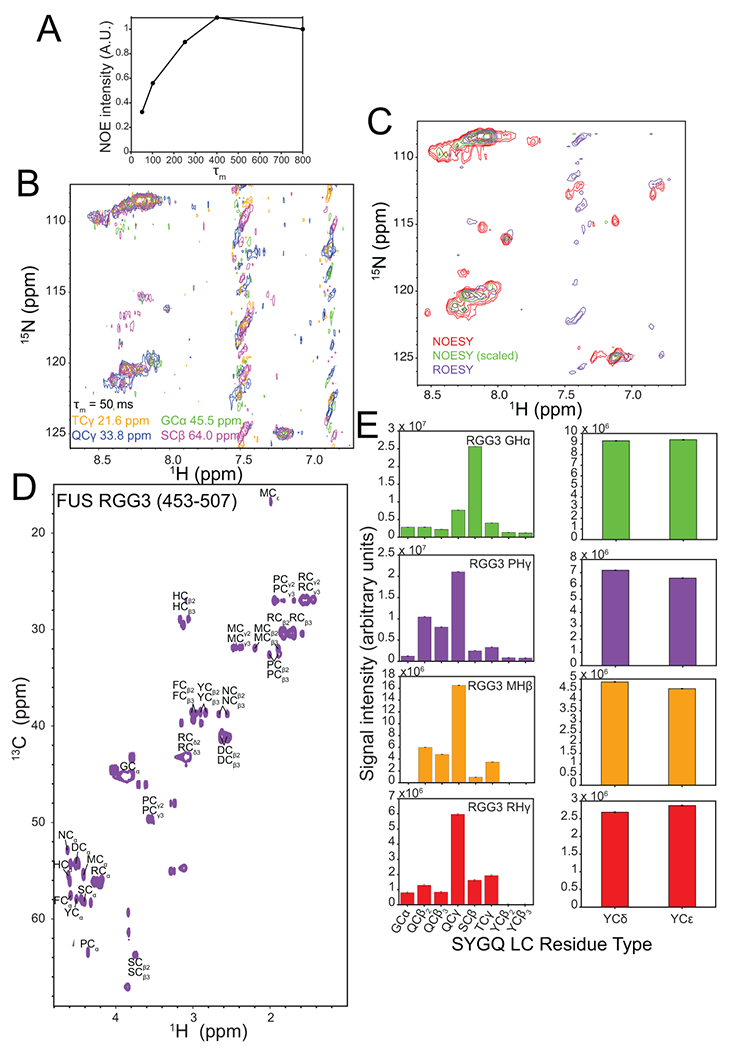
A) NOE build-up curve (NOE intensity vs mixing time, τm) from 4D HSQC-NOESY-HSQC experiments. No diagonal peaks are present in these HSQC-NOESY-HSQC spectra, so data were collected as one-dimensional experiments and presented here as integration over the resonance envelope. Each experiment was performed once. B) 2D-planes from a 13C-HSQC-NOESY-15N-HSQC experiment recorded with a NOESY mixing time of 50 ms. C) Intermolecular ROEs from SYGQ LC are observed for arginine and other residue types including glycine in the 2-component condensed phase. 2D-projection from a 4D HSQC-NOESY-HSQC (250 ms mixing time; unscaled and scaled to match ROE) and HSQC-ROESY-HSQC (5 kHz spin lock / mixing for 20 ms). ROESY spin lock mixing time was limited due to more rapid transverse relaxation rate as compared to the NOESY mixing time, as the magnetization is longitudinal during the NOE transfer but transverse during the spin-locked ROE transfer. Experiments performed once. D) 1H-13C HSQC of FUS RGG3 in the dispersed phase. E) NOE signal intensity quantification from a 12C-filtered, 13C-edited NOESY-HSQC experiment presented in Figure 3C. Intensity data for one representative experiment are plotted as mean ± s.d. of baseline noise for each plane as estimate of uncertainty in one representative data set.