
Extended Data Fig. 6. Contacts between FUS SYGQ LC and RGG domains.
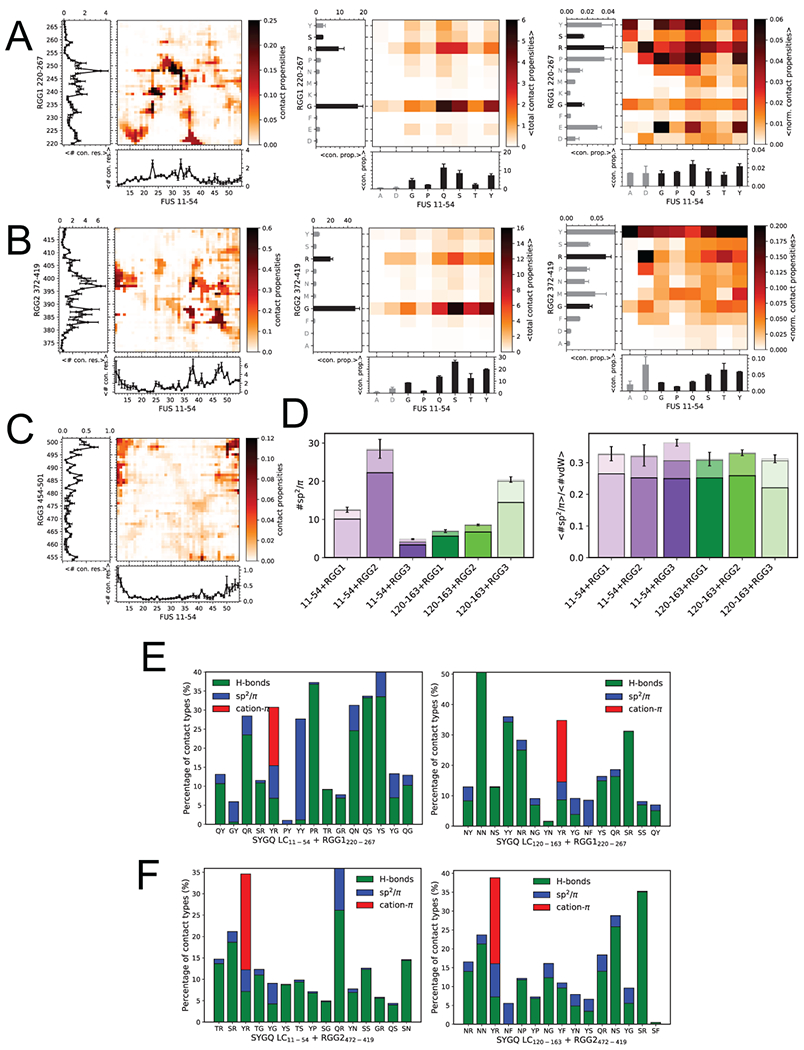
A) Total intermolecular contact propensities from two-chain simulations of SYGQ LC11-54 and RGG1220-267 binned by residue position (left), binned by residue type (center), and binned by residue type and normalized by residue frequency (right). Plots represent the total number of contacts for a particular residue position. Bars represent the total number of contacts for a particular residue type. Residues colored in gray occur in the sequence less than three times. (For A,B,C: Data are plotted as mean ± s.e.m of (left) n=5 equal divisions of the total 16 replica PTWTE data set, (middle) total contact propensities, or (right) normalized total contact propensities from one representative data set out of two independent experiments.) B) Inter-residue contact propensities from two-chain simulations of SYGQ LC11-54 and RGG2372-419 binned by residue position (left), binned by residue type (center), and binned by residue type and normalized by residue frequency (right). Curved plots represent the total contact propensities for each residue. Bars represent the total number of contacts for a particular residue type. Gray bars represent residue types that occur less than three times in the sequence. C) Inter-residue contact propensities from two-chain simulations of SYGQ LC11-54 and RGG3454-501 binned by residue position. Plots represent the total contact propensities for each residue. Corresponding residue typed binned and frequency normalized plots matching middle and right plots, respectively, for B and C) are presented in main text Figure 3 D,E. D) Total sp2/π interactions (left) and normalized by all VdW contacts (right) where all geometries are included (only distance-based definition) in two-chain simulations of SYGQ LC11-54 or SYGQ LC120-163 with RGG1, RGG2 or RGG3. The data are binned for π-π (top, lightest), sp2-π (middle, lighter) and sp2-sp2 (bottom) contacts. Data are plotted as mean ± s.e.m of n=5 equal divisions of the total data set. E,F) Top fifteen interacting amino acid pairs in order of highest to lowest contact frequency (left to right) SYGQ LC11-54 or SYGQ LC120-163 with RGG1 or RGG2. The fraction of pairs showing hydrogen bonds, sp2/π, and cation-π contacts out of the total pairs with van der Waals interactions is indicated.