
Extended Data Fig. 7. Contacts within a three-component phase containing FUS SYGQ LC and RGG3 and RNAP2 CTD.
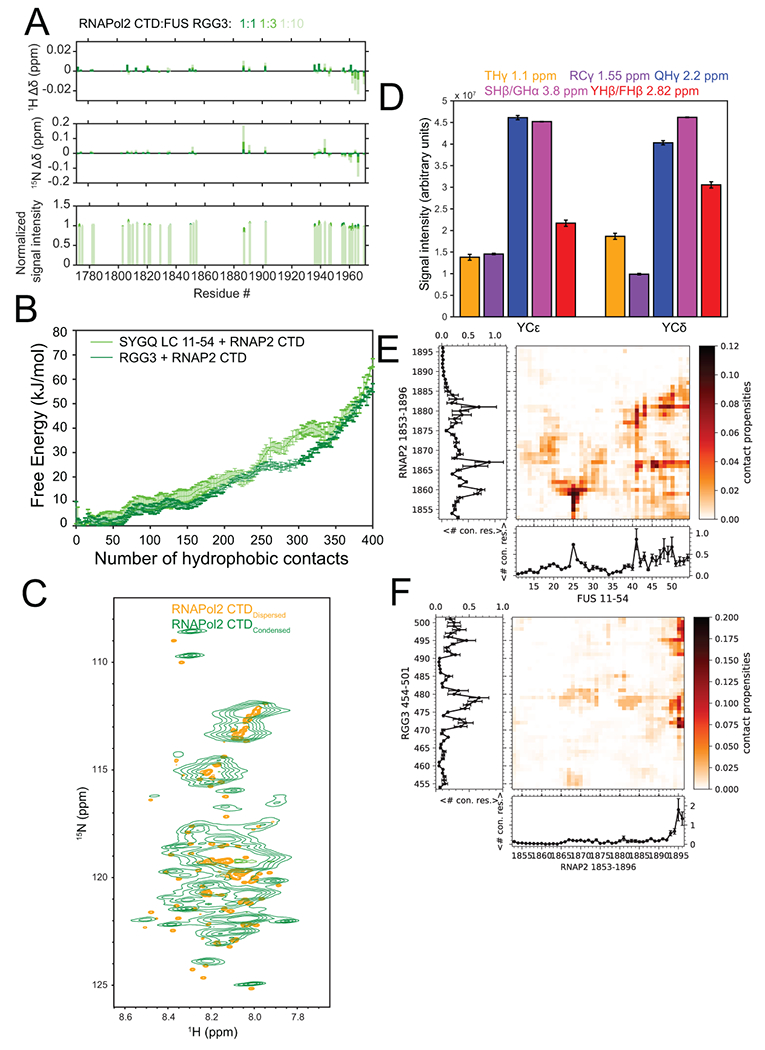
A) Chemical shift perturbations and signal intensity changes for 15N-RNA polymerase II CTD in the presence of increasing concentrations of FUS RGG3. Intensity data are plotted as mean ± s.d. of baseline noise for each spectrum as estimate of uncertainty in one representative data set. B) Free energy landscape of van der Waals contacts between hydrophobic atoms between RNAP2 CTD and FUS SYGQ LC or RGG3 from two-chain simulations. Data are plotted as mean ± s.e.m of n=5 equal divisions of the total data set from one representative data set. C) 1H-15N HSQC of RNA polymerase II CTD in the dispersed (orange) and condensed (green) phases. D) NOE signal intensity quantification from a 12C-filtered, 13C-edited NOESY-HSQC experiment presented in Figure 6B. Intensity data are plotted as mean ± s.d. of baseline noise for each plane as estimate of uncertainty in one representative data set out of two independent experiments. Inter-residue contact propensities from two-chain simulations of RNAP2 CTD1853-1896 and E) FUS SYGQ LC11-54 or F) RGG3 binned by residue position. Plots represent the total number of contacts for a particular residue position. Data are plotted as mean ± s.e.m of n=5 equal divisions of the total data set from one representative data set.