
Figure 3. Interactions between SYGQ-LC and RGG3 in the condensed phase are involve multiple residue pairs.
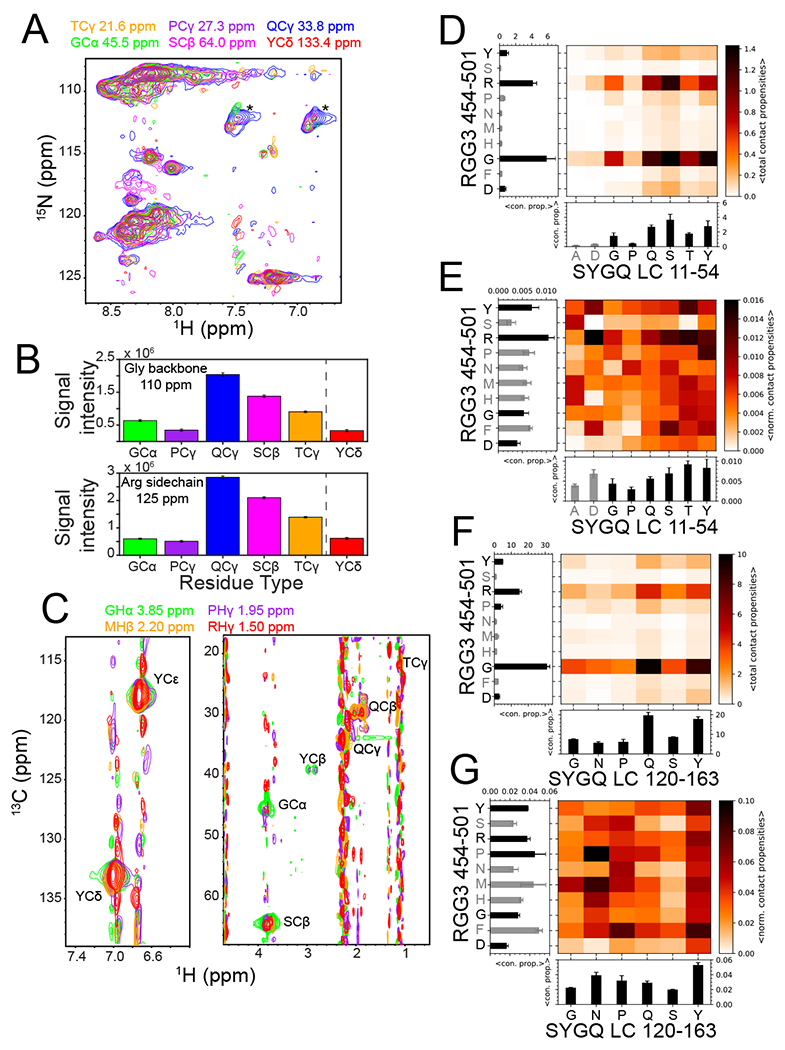
A) 2D-planes from a 13C-HSQC-NOESY-15N-HSQC experiment demonstrating intermolecular NOEs and hence interactions between the 15N-attached backbone and side chain positions in 15N FUS RGG3 with the indicated residue positions within the 13C SYGQ-LC. Asterisks denote (artifactual) intramolecular NOEs at natural isotopic abundance 15N glutamine side chain positions within the 13C-enriched SYGQ LC. B) NOE signal intensity of the glycine backbone region and the arginine side chain region of FUS RGG3 for the indicated SYGQ LC residue types. Tyrosine signal intensity was quantified from a separate experiment centered on the aromatic side chain resonances. Intensity data are plotted as mean ± s.d. of baseline noise for each plane as estimate of uncertainty from one experiment. C) 2D-planes for the indicated 12C-attached resonances from FUS RGG in 12C-filtered, 13C-edited NOESY-HSQC experiments demonstrating interactions with 13C-attached residue positions within FUS SYGQ LC. D,F) Total intermolecular contact propensities between two residue types from two-chain simulations of the representative fragments (D) Mean of total contact propensities SYGQ LC11-54 or (F) SYGQ LC120-163 and RGG3454-501 binned by residue type (from one simulation with n=16 independent replicas using PTWTE method) with 1d plots of mean ± s.e.m. of total contact propensities (with any residue type) for each residue type plotted. Gray bars represent residue types that occur less than three times in the sequence. E,G) Average intermolecular contact propensities from two-chain simulations of (E) SYGQ LC11-54 or (G) SYGQ LC120-163 and RGG3 normalized by occurrence within the sequence. See above for statistics details.