
Figure 4. Determining the optimal length scale difference.
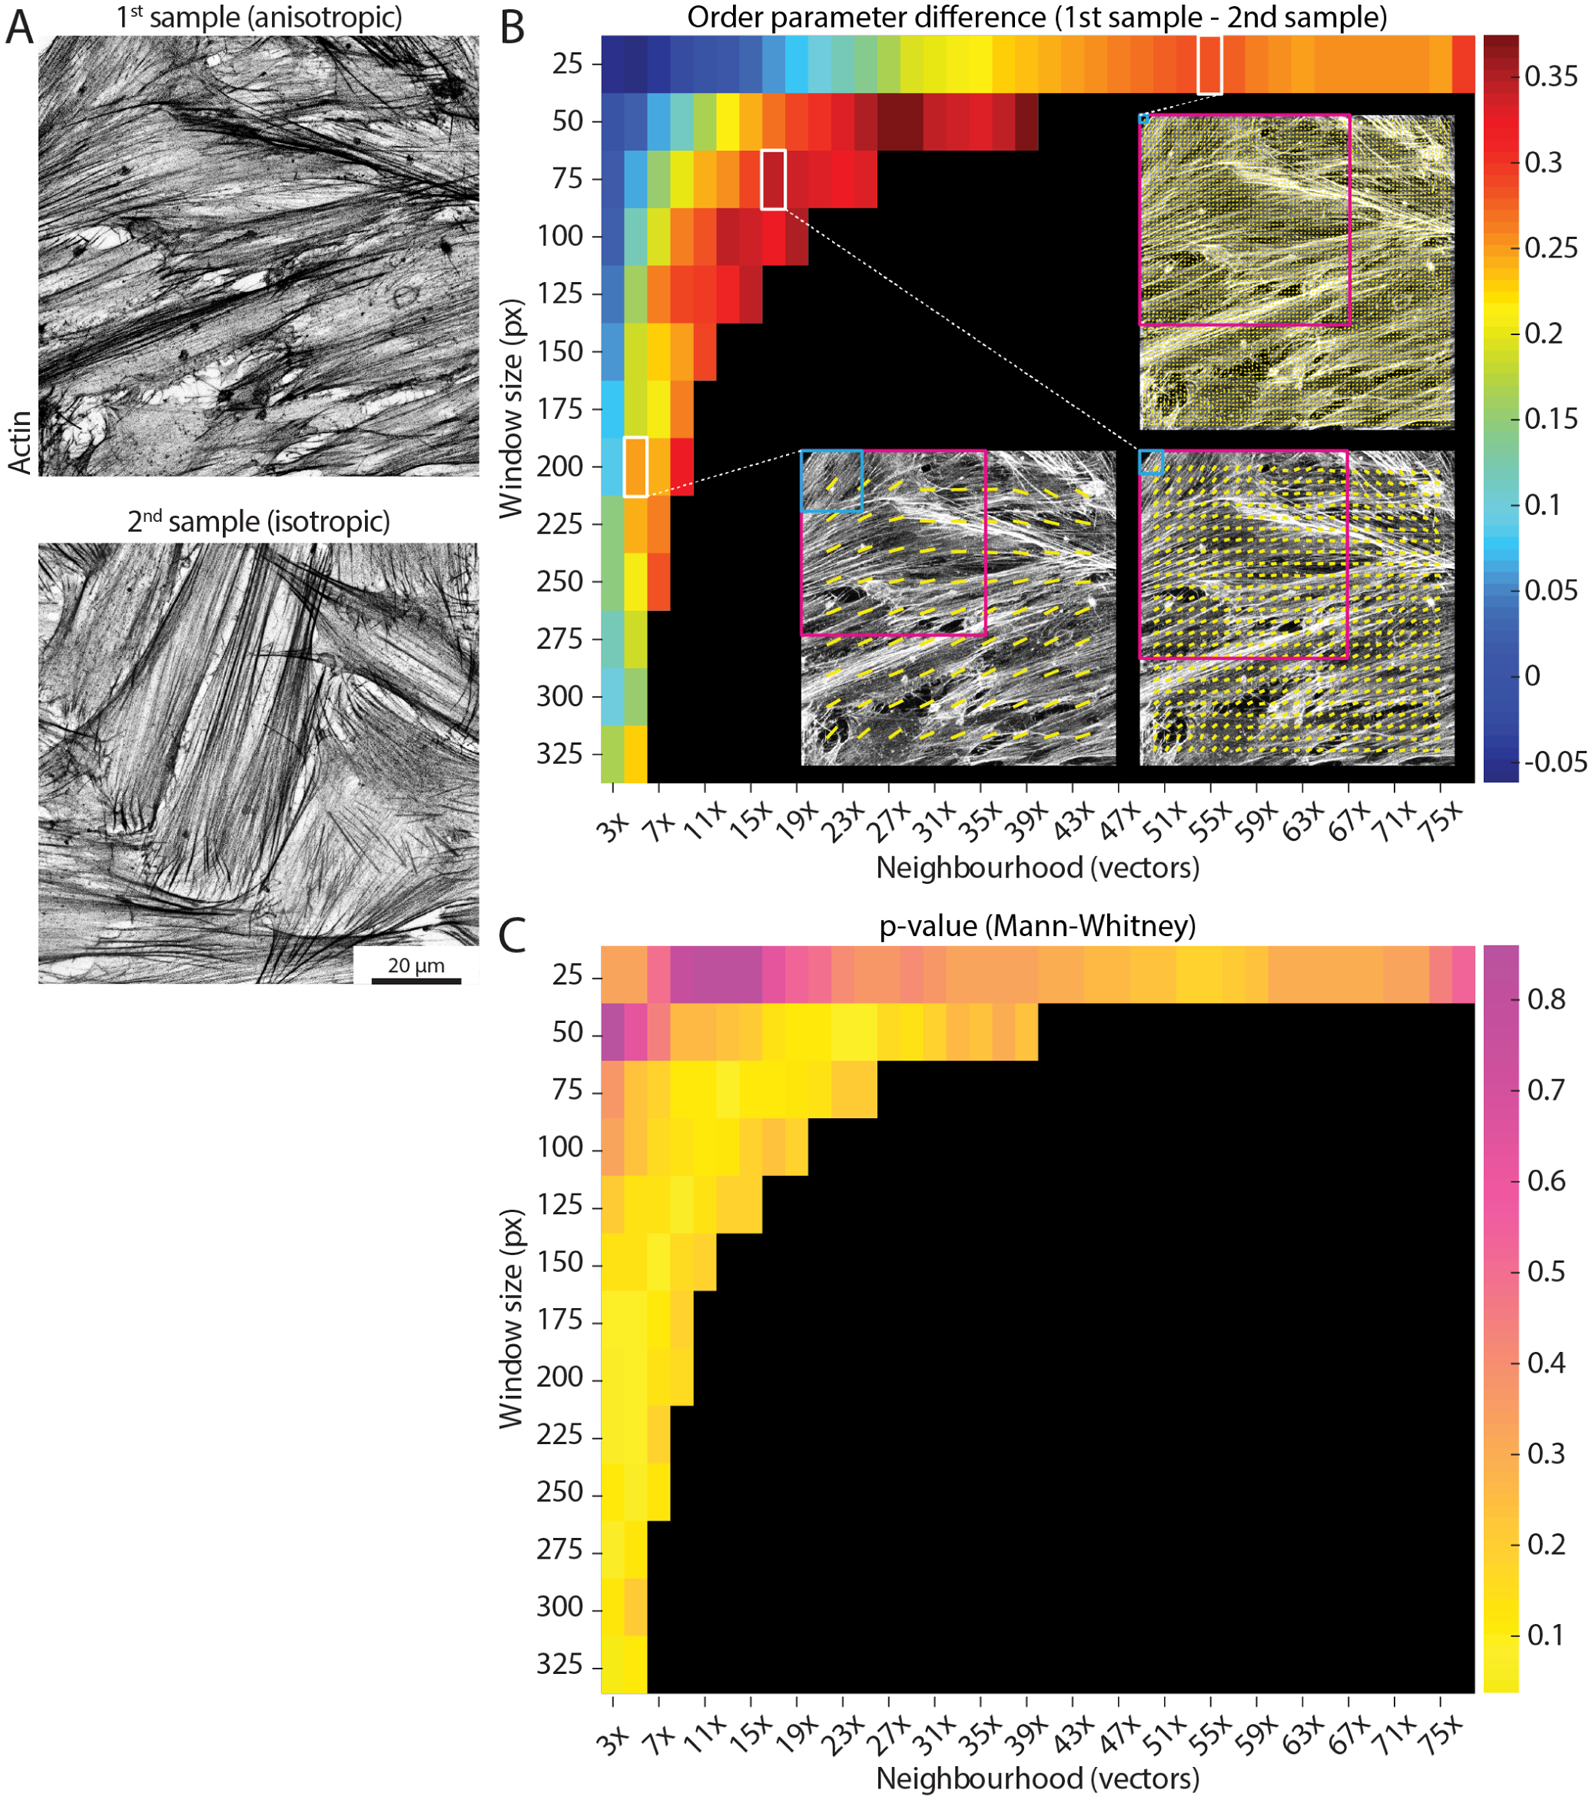
(A) Example actin images taken from two separate samples and displaying different degrees of alignment (higher on the left, more anisotropic; lower on the right, more isotropic). Scale bar, 20 μm. (B) The parameter search runs the analysis for a range of window sizes (y-axis, from 25 px to 325 px) and a range of neighbourhood sizes (x-axis, from 3x to 77x vectors, where the neighbourhood size is defined as 2 * neighbourhood radius + 1). Each permutation of window and neighbourhood represent a length scale. Each coloured square shows the difference in the median order parameter between the anisotropic sample and the isotropic sample (mean values over 10 images for each sample) for a specific pair of window and neighbourhood sizes. Small window sizes paired with small neighbourhoods (upper left corner) display noisy output, due to the limited amount of image information available to process. Three example vector fields are shown for a window size of 25 px and neighbourhood of 55x vectors (corresponding to 92 μm), 75 px and 17x vectors (89 μm), and 200 px and 5x vectors (79 μm), with the light blue and magenta squares showing the size of the window and neighbourhood respectively. Despite relatively similar neighbourhood sizes, the output varies depending on the size of the examined window. Reading the graph horizontally from left to right for each window size up to ~150 px, it is possible to note how an optimal length scale of ~90 μm is detected (i.e., a peak difference value is displayed), likely correlated to relevant biological dimensions (e.g., cell size). (C) A similar graph to the one in (B) is shown for the p-value of Mann-Whitney tests between the two samples for all the combinations of window and neighbourhood sizes. In this case, greater differences are represented by lower values (yellow).