
Figure 7. Genomic and epigenomic evidence that metastatic cancers derived from less-differentiated granulosa cells resemble ovarian HGSCs.
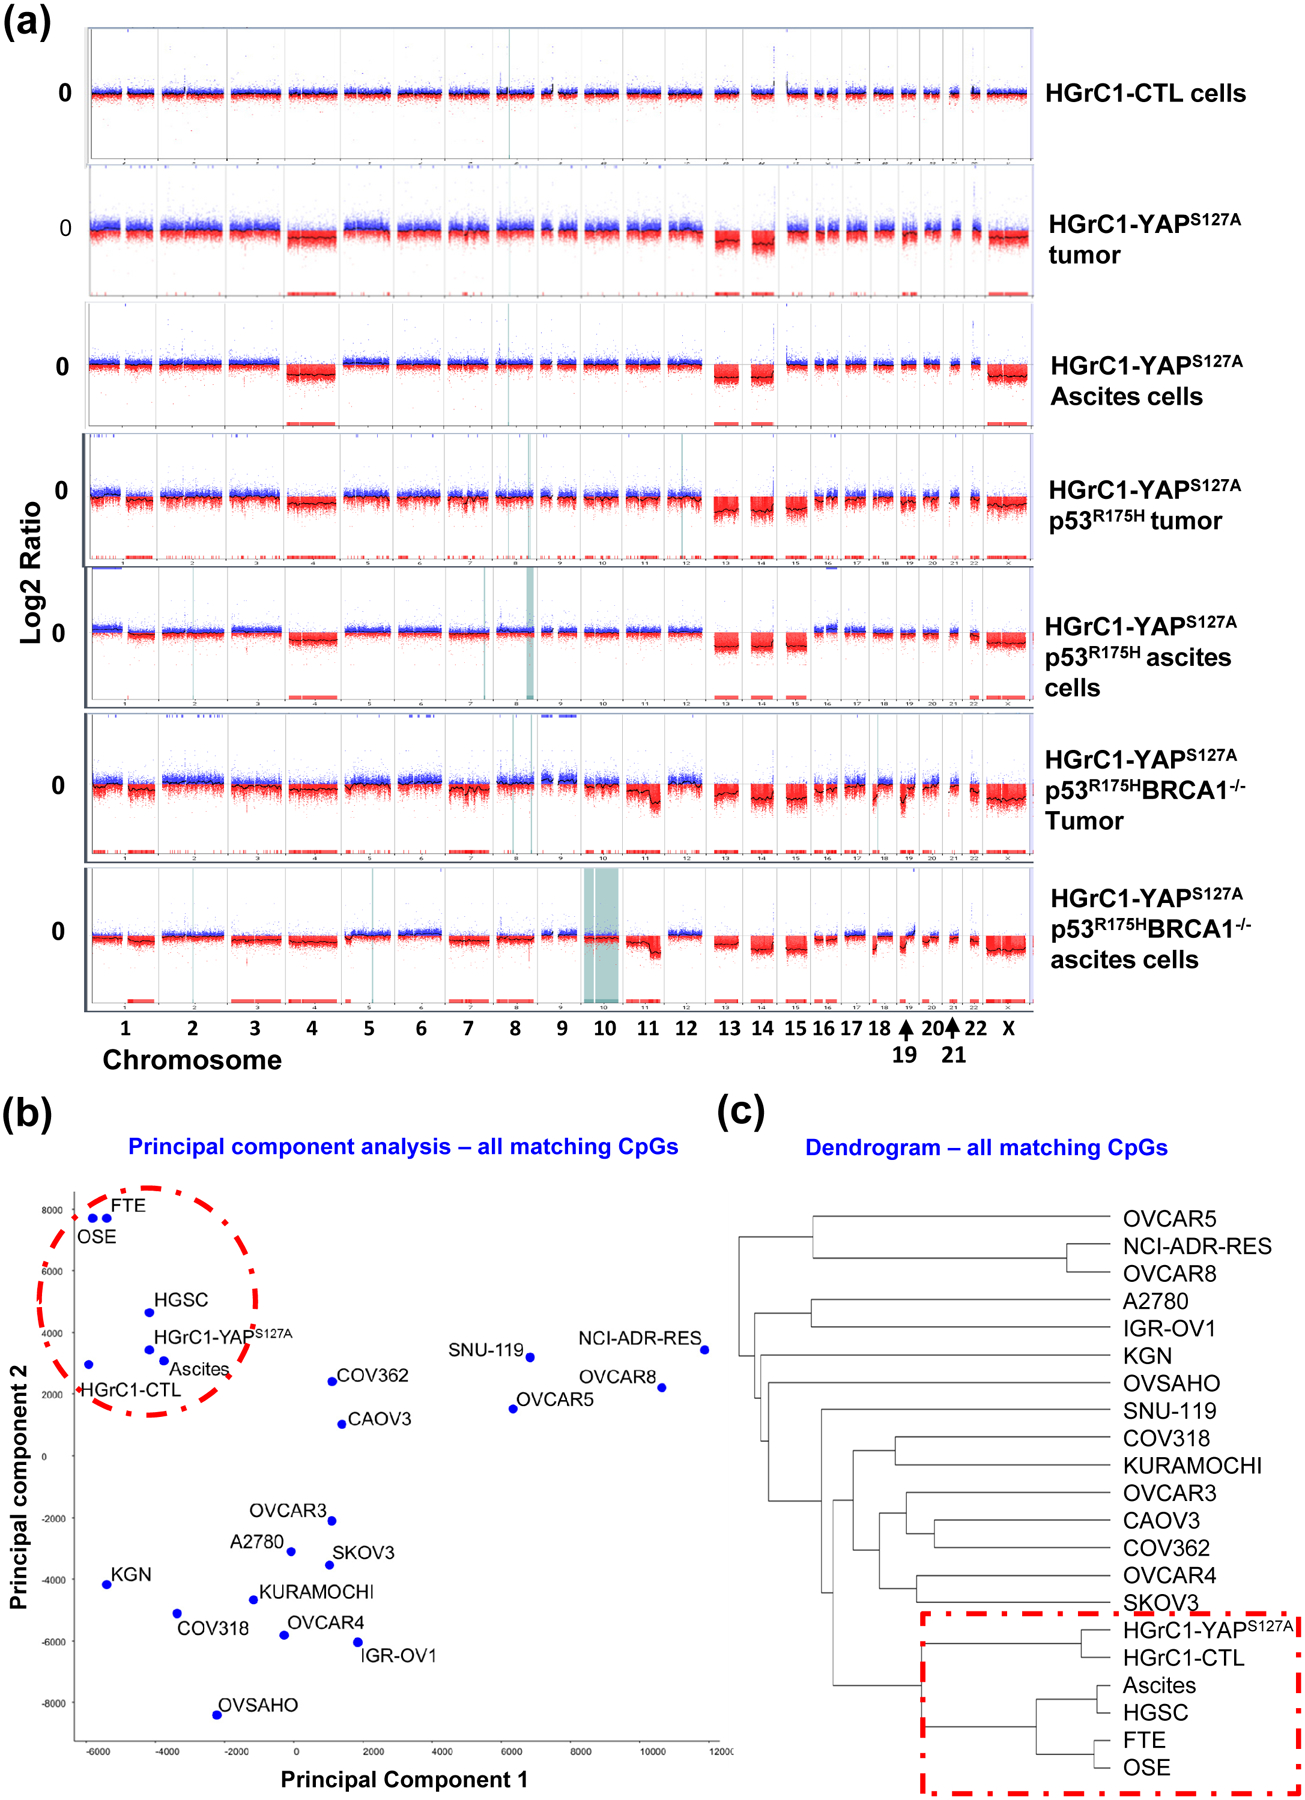
(a) Tumors and ascites cells exhibited severe genomic instability as in human ovarian HGSC. aCGH analysis results showing DNA copy number changes of tumor tissues and ascites cells, as well as control cells. The Y-axis represents gain (positive) or loss (negative) of copy number, while the X-axis represents each chromosome. CTL: HGrC1-CTL cells; HGrC1-YAPS127A tumor & HGrC1-YAPS127A ascites: tumor tissue and ascites cells that were harvested from mouse implanted with HGrC1-YAPS127A cells; HGrC1-YAPS127A/TP53R175H tumor & HGrC1-YAPS127A/TP53R175H ascites: tumor tissue and ascites cells that were harvested from mouse implanted with HGrC1-YAPS127A/TP53R175H cells; YAPS127A/TP53R175H/BRCA1−/− tumor & YAPS127A/TP53R175H/BRCA1−/− ascites: tumor tissue and ascites cells that were harvested from mouse implanted with HGrC1-YAPS127A/TP53R175H/BRCA1−/− cells. (b) Principle component analysis based on the genome-wide DNA methylation CpG profile. Note that fallopian tube epithelial cells (FTE), OSE cells, HGrC1, and HGrC1-YAPS127A cells are grouped with ovaria HGSC and ascites cells from ovarian HGSC. (c) Dendrogram classification analysis based on the genome-wide DNA CpG methylation profile. Note that FTE cells, OSE cells, HGrC1, and HGrC1-YAPS127A cells have the closest relationship with ovarian HGSCs.