Figure.
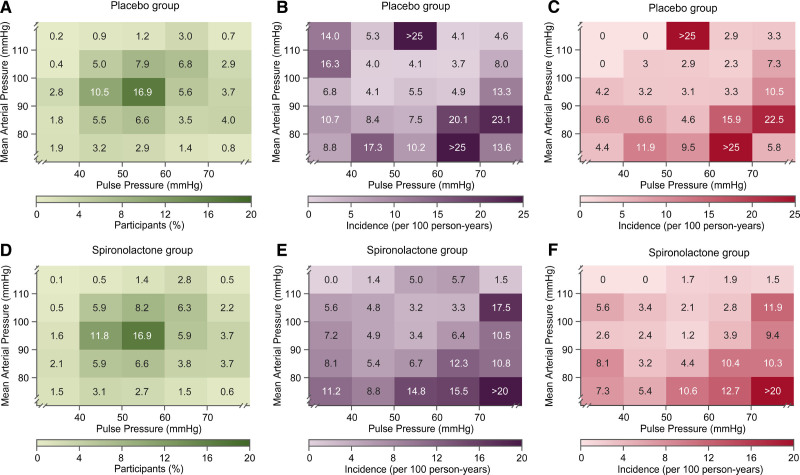
Heat maps depicting the risk of primary end point and hospitalization for heart failure in relation to mean arterial pressure (MAP) and pulse pressure in the placebo and spironolactone groups.
Numbers in the (A) and (D) grids represent the percentage of participants within each blood pressure cross classification category; numbers in (B) and (E) represent the risk for primary end point; numbers in (C) and (F) indicates the risk for hospitalization for heart failure. Heat maps were derived by Cox proportional hazards regression with mean arterial pressure plotted along vertical axis and pulse pressure along the horizontal axis with adjustment applied for age. In patients (n=29) with very low values of MAP (≤80 mm Hg) together with high values of pulse pressure (≥70 mm Hg), systolic and diastolic blood pressure averaged (±SD) 125.1±6.9 mm Hg and 48.9±4.7 mm Hg.

