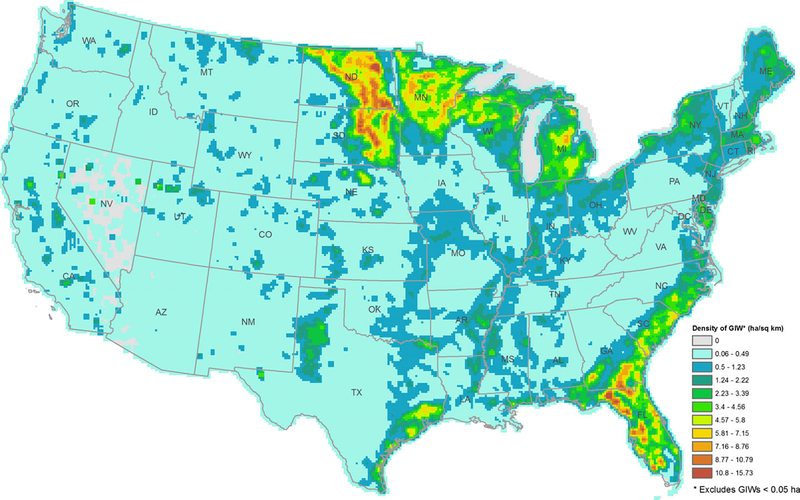
FIGURE 1.
Spatial distribution (heat map of ha/km2) of NFWs (or “geographically isolated wetlands,” GIWs in Lane and D’Amico 2016) derived from geographic information system analyses of a floodplain proxy (Lane and D’Amico 2016). Approximately 8.4 million NFWs covering more than 6.6 million ha were reported by Lane and D’Amico (2016). Source: Figure reproduced from Lane and D’Amico (2016). State abbreviations are given in the figure.

