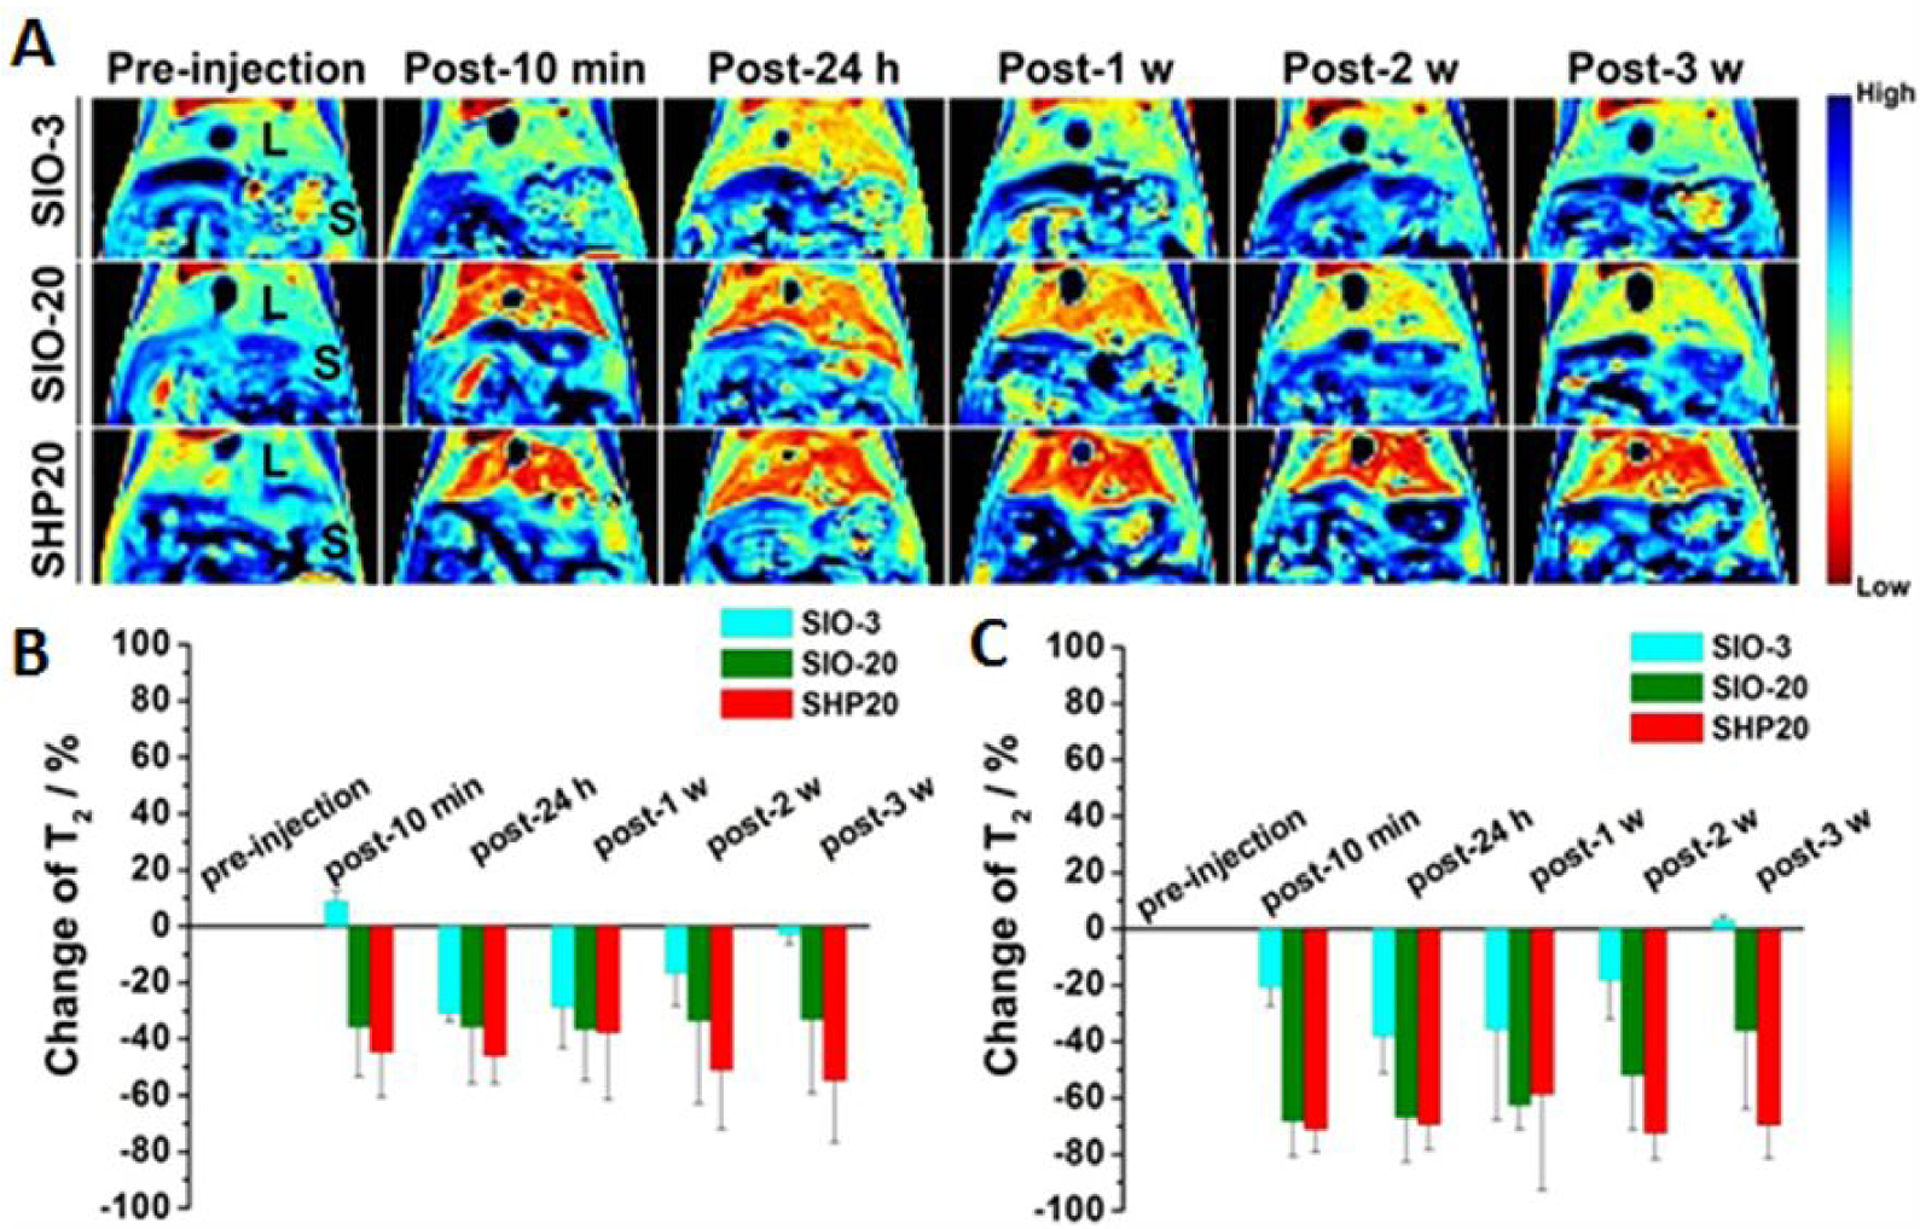
Figure 3.

Clearance studies of i.v. administered 3 nm SIO nanoparticles at 2.5 mg Fe/kg in BALB/c mice. (A) Pseudo colored T2-wiehgted MR images following up the clearance of nanoparticles in liver (L) and spleen (S). The corresponding signal change for (B) liver and (C) spleen in T2-maps (n =3). Adapted from the reference 27 with permission.
