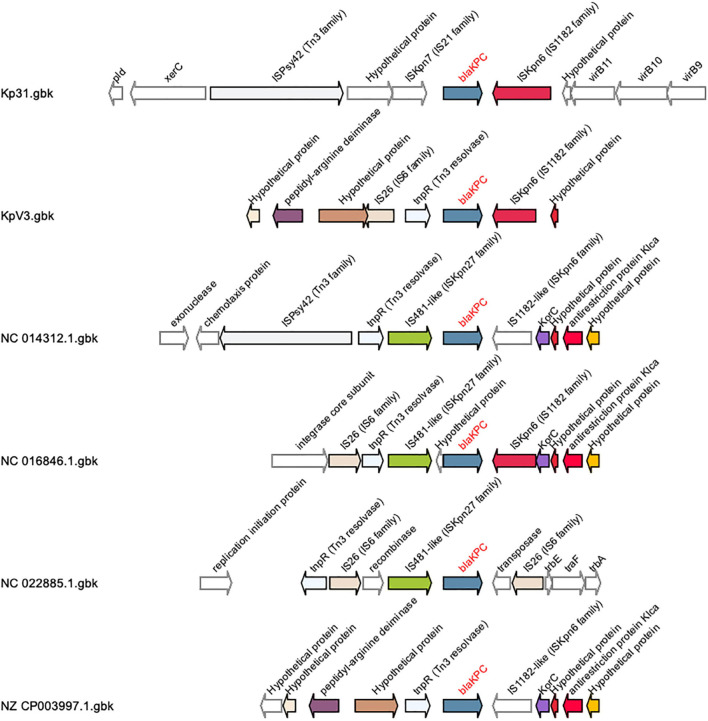
FIGURE 1.
Schematic representation of group I NTEKPCs gene clusters and its flanking genome contexts. This analysis was created with GCluster using different Klebsiella pneumoniae genomes, found in the literature, and the genomes of the strains KpV3 and Kp31. The blaKPC gene is represented in blue, the insertion sequences ISkpn6 are colored in purple and it is located downstream the blaKPC gene, as in most NTEKPCs. The insertion sequence IS26 is represented in pink and is located upstream the blaKPC, but in the KpV3 this IS26 sequence is found in an opposite orientation when compared to the other group I NTEKPCs.

