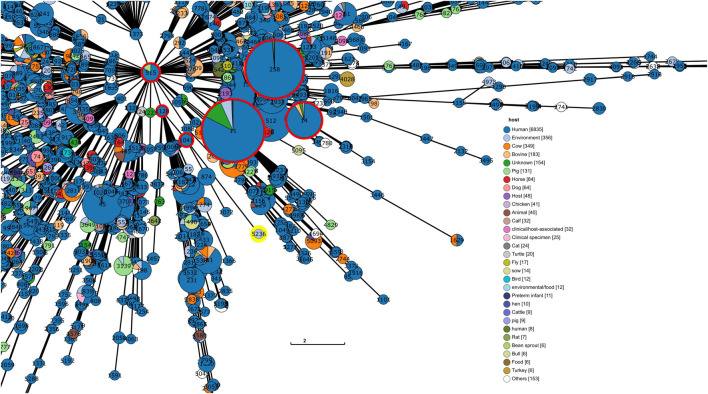
FIGURE 3.
Section of the tree representation of genetic relationships among the different profiles of the K. pneumoniae MLST scheme. This analysis was produced via GrapeTree with the minimum spanning tree algorithm (MSTree V2). The ST identified in this study is highlighted with a yellow circle and high-risk lineages (CG 11, 14, and 258) are highlighted with red circles. For readability purposes, only the section of the tree where the ST is placed is shown. (The tree containing the whole analysis is in Supplementary Figure 1).

