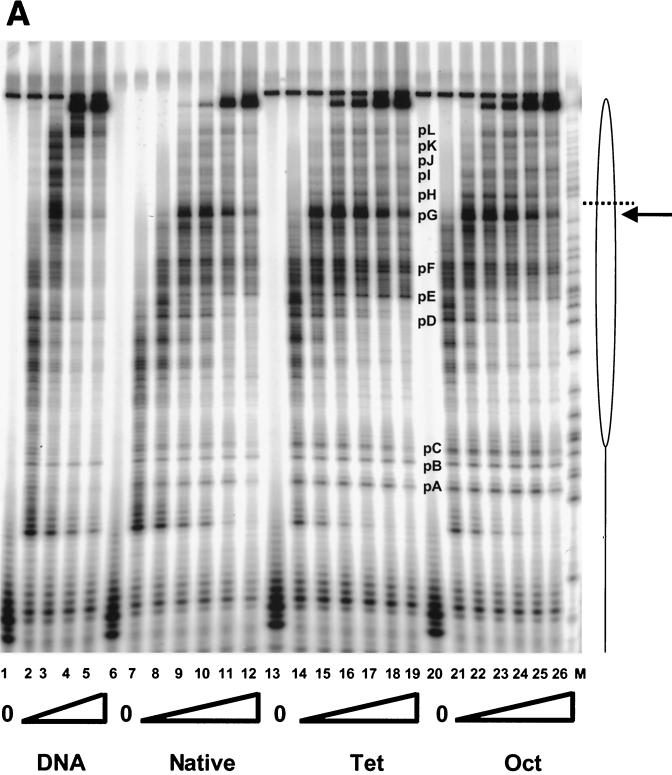
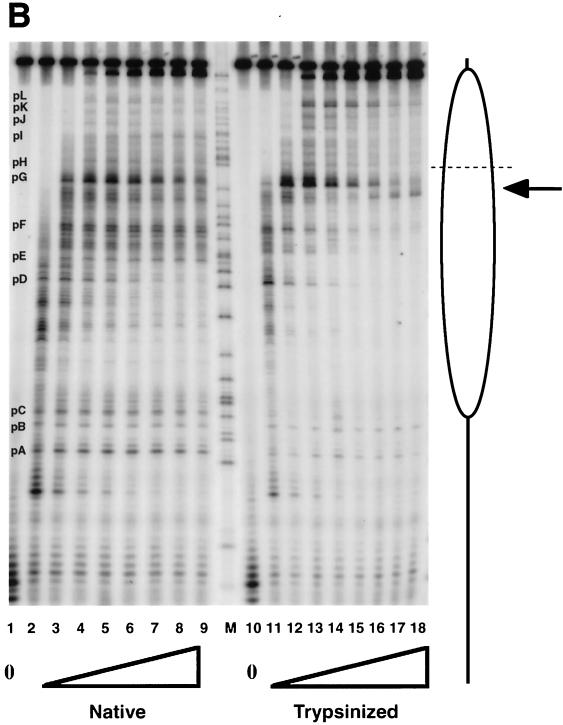
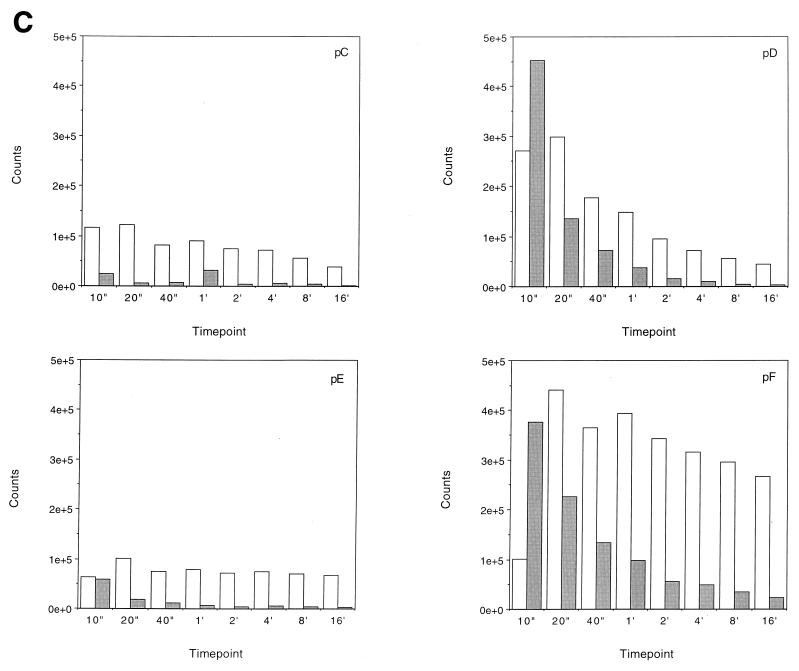
FIG. 5.
Transcription elongation on the tailless nucleosomes. (A) Clostripain-digested histones. Transcription reactions on naked DNA (lanes 1 to 5), native nucleosomes (lanes 6 to 12), nucleosomes containing tailless tetramers (lanes 13 to 19), and nucleosomes containing tailless octamers (lanes 20 to 26) were run on a 6% denaturing sequencing-size gel and exposed to a phosphorimager plate for analysis. Aliquots were taken after stalled complex formation (lanes 1, 6, 13, and 20) and after 10 s (lanes 2, 7, 14, and 21), 20 s (lanes 3, 8, 15, and 22), 40 s (lanes 4, 9, 16, and 23), 1 min (lanes 5, 10, 17, and 24), 4 min (lanes 11, 18, and 25), and 16 min (lanes 12, 19, and 26) of elongation. The lane labeled M contains RNA markers obtained by transcribing the DNA in the presence of the RNA chain terminator dATP and represents an A ladder. The open oval represents the approximate location of the nucleosome on the template; the dashed line identifies the dyad axis of symmetry. Major polymerase pause sites are labeled (pA to pL). The band corresponding to the major pause site immediately promoter proximal to the dyad axis (pG) is indicated also with an arrow. (B) Trypsin-digested histones. Transcription reactions on native nucleosomes (lanes 1 to 9) and trypsinized nucleosomes (lanes 10 to 18) were run on a 6% denaturing sequencing-size gel and exposed to a phosphorimager plate for analysis. Aliquots were taken after stalled complex formation (lanes 1 and 10) and after 10 s (lanes 2 and 11), 20 s (lanes 3 and 12), 40 s (lanes 4 and 13), 1 min (lanes 5 and 14), 2 min (lanes 6 and 15), 4 min (lanes 7 and 16), 8 min (lanes 8 and 17), and 16 min (lanes 9 and 18) of elongation. (C) Quantitative analysis of pause site residence times for sites pC, pD, pE, and pF from panel B. Open bars, native nucleosomes; shaded bars, fully tailless (trypsinized) histones. Counts present in the bands corresponding to the indicated paused species at each time point are shown (note: all graphs are shown on the same scale for direct comparison). Pause sites pC and pE are essentially unpopulated after removal of the histone tails; sites pD and pF do become well populated but decay (i.e., allow release and continued elongation) much more quickly for the tailless nucleosomes.


