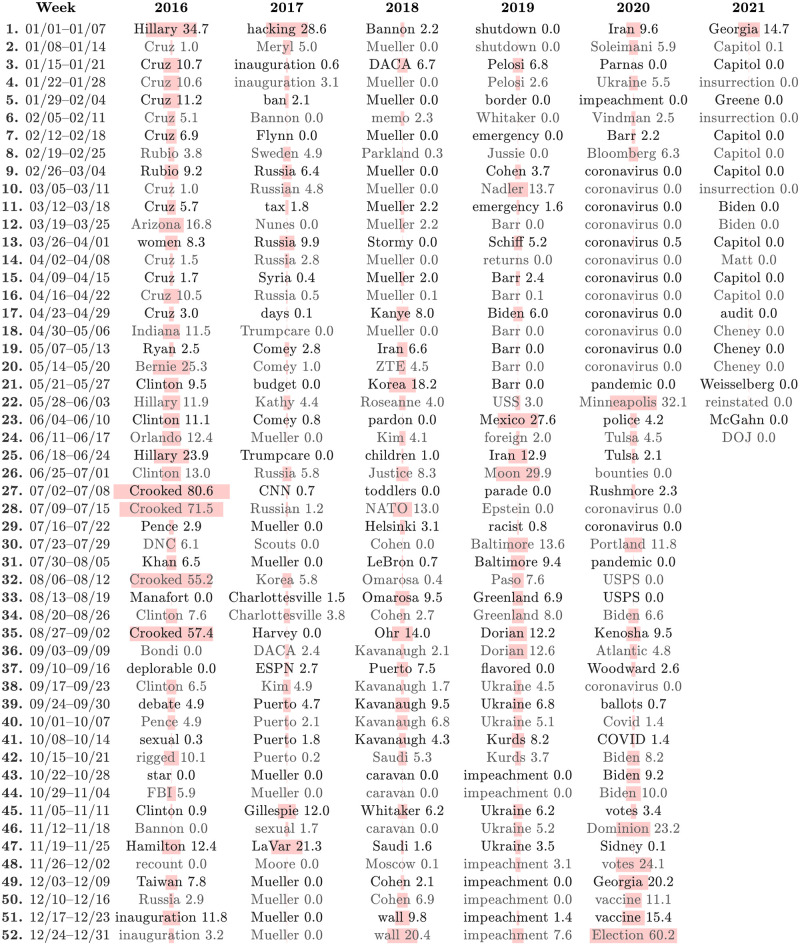
Fig 1. Computational timeline of ‘narratively dominant’ 1-grams surrounding Trump-matching tweets at the week scale.
The timelines of 1-grams and 2-grams (Fig 2) give an overall sense of story turbulence through turnover and recurrence. For each week, we show the 1-gram with the highest sum of rank-turbulence divergence (RTD) contributions [37] relative to the year before, based on comparisons of day-scale Zipf distributions for 1-grams in Trump-matching tweets. See S1 Fig for a full example of 2021/01/06, the day of the Capitol insurrection. Each 1-gram must have been the most narratively dominant for at least 1 day of the week (i.e., highest RTD contribution). The numbers and pale pink bars represent Trump’s narrative control as measured by the percentage of an n-gram appearing in retweets of Trump’s own tweets during a given week. The limits of 0 and 100 for narrative control thus correspond to a 1-gram being never tweeted by Trump and a 1-gram only appearing in retweets of Trump. After Trump’s account was suspended by Twitter following the Capitol insurrection, Trump’s narrative control necessarily falls to 0. To align weeks across years, we assign the final 8 days to Week 52, and for each leap year we include February 29 as an 8th day in week 9. See the paper’s Online Appendices (compstorylab.org/trumpstoryturbulence/) for the analogous visualization at the day scale as well as a visualization of the daily top 10 most narratively dominant 1-grams. In constructing this table and the table for 2-grams in Fig 2, we excluded hashtags, a small set of function word n-grams, and expected-to-be surprising n-grams such as ‘of the’ and, in 2017, ‘President Trump’.

