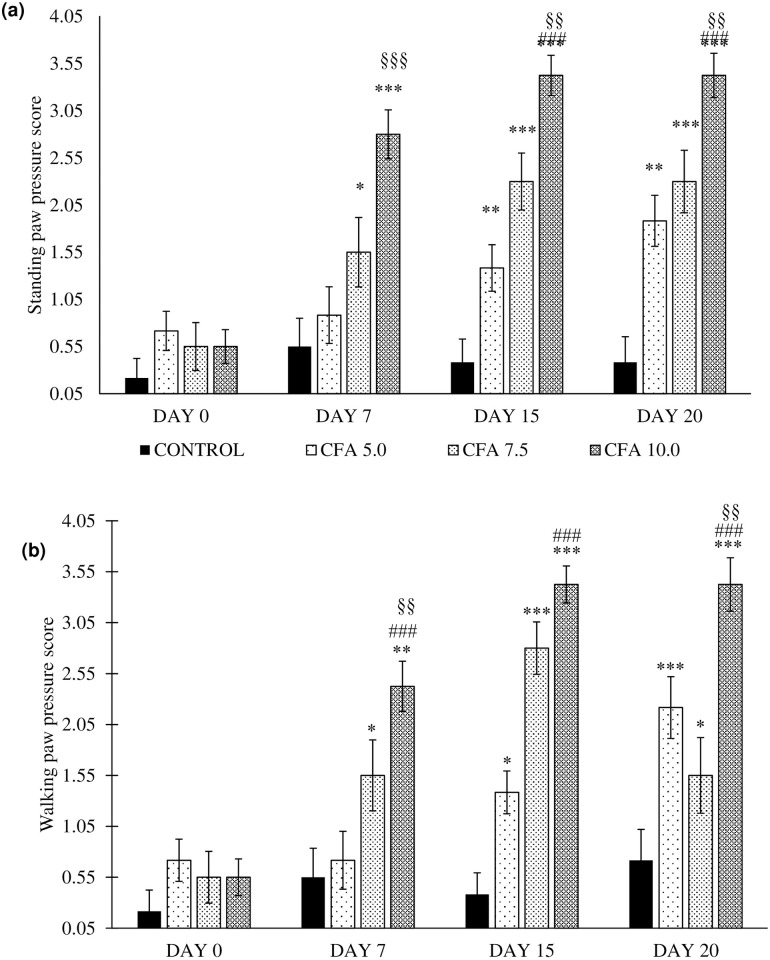
Fig 3. Spontaneous activities as indicated by (a) standing paw pressure and (b) walking paw pressure in the groups on day 0, 7, 15 and 20 (n = 6).
The data are presented as mean ± standard error of the mean (SEM). *p < 0.05, **p < 0.01, ***p < 0.001 Statistical comparison to control group, ###p < 0.001 Significant comparison to CFA 5.0 group and §§p < 0.05, §§§p < 0.001 Significant comparison to CFA 7.5 group. The CFA 10 group showed the most consistent and the highest score for both standing and walking paw pressure compared to the control group, especially on day 7, 15 and 20.

