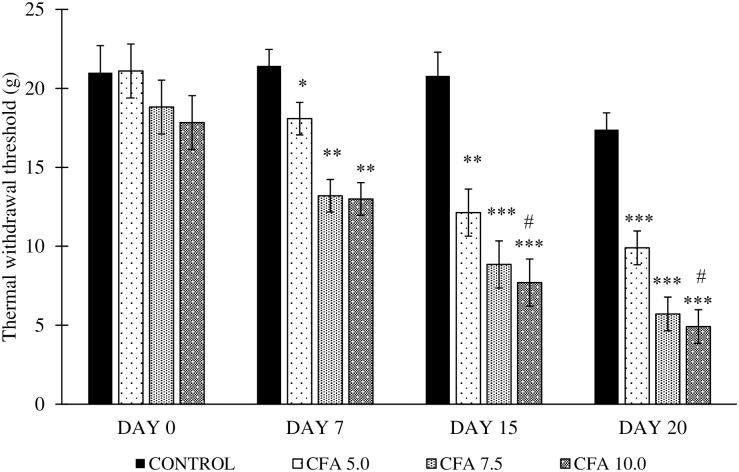
Fig 5. Thermal withdrawal threshold in the treatment groups on day 0, 7, 15 and 20 (n = 6).
The values were expressed as mean ± standard error of the mean (SEM). *p < 0.05, **p < 0.01 and ***p < 0.001 Significant comparison to control group. #p < 0.05 Significant comparison to CFA 5.0 group. CFA 10.0 group demonstrated a significant gradual reduction in thermal withdrawal threshold, indicating the gradual development of thermal hyperalgesia throughout the experiment.

