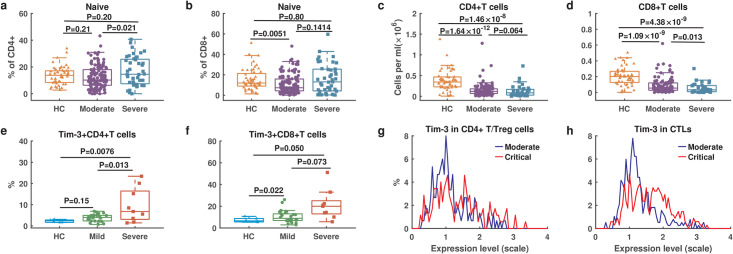
Fig 1. Multiple data on T cell response from COVID-19 patients with different symptoms.
a. The percentage of naïve CD4+ T cells over CD4+ T cells. b. The percentage of naïve CD8+ T cells over CD8+ T cells. c. Counts of CD4+ T cells. d. Counts of CD8+ T cells. a-d include healthy control (HC: n = 50), moderate (n = 117) and severe (n = 40) patients from Yale New Haven Hospital (Dataset 4). e. The percentage of Tim-3 expression on CD4+ T cells. f. The percentage of Tim-3 on CD8+ T cells. e-f include healthy control (HC: n = 6), mild (n = 29) and severe (n = 12) patients from the Fifth Medical Center of PLA General Hospital of China (Dataset 2). g. The distribution of Tim-3 expression levels in CD4+ T/Treg cells. h. The distribution of Tim-3 expression levels in cytotoxic T lymphocytes (CTLs). g-h include moderate (n = 8) and critical (n = 13) patients from Charité-Universitätsmedizin Berlin and University Hospital Leipzig (Dataset 5). Significance was determined by two-sided, Wilcoxon rank-sum test.

