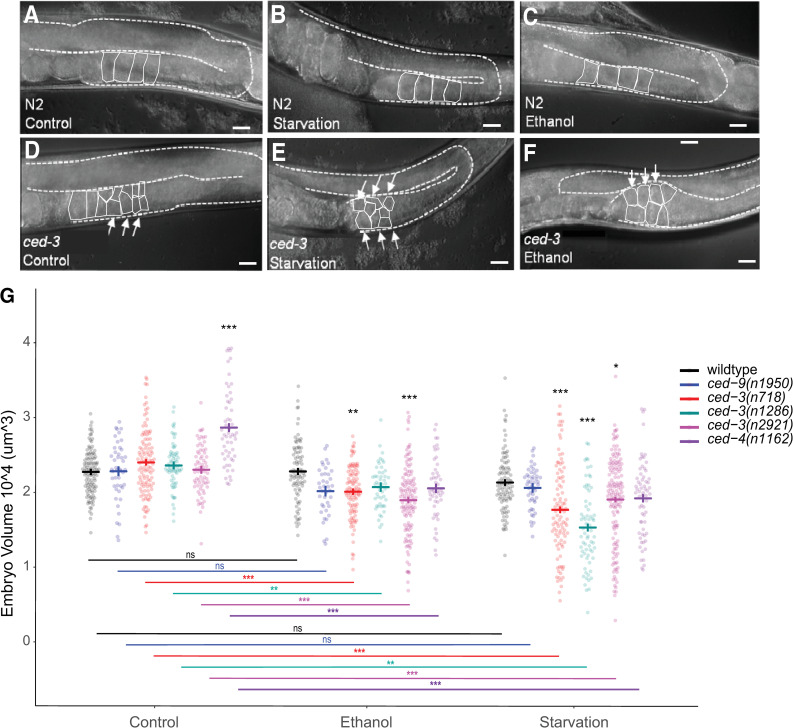
Fig 6. The decrease in embryonic survival after stress coincides with a decrease in oocyte and embryo size.
(A-F) DIC images of individual gonad arms in the wildtype strain N2 (A-C) and the mutant ced-3(n718) (D-F) adult hermaphrodites grown on control NGM plates (A, D), subjected to 20h liquid starvation at L4+20h (B, E), or grown on ethanol-supplemented plates (0.32M) from L1 –L4+24h (C, F). Proximal oocytes are outlined in solid white for clarity. Dashed lines delineate the gonad. Scale bars: 20μm. (G) Size (volume) of embryos produced by N2 and mutant adults in control, ethanol, and starvation conditions. Bold blue or red bars indicate estimated marginal means +/- standard error. (* p = 0.01–0.05, ** p = 0.001–0.01, *** p < 0.001; black asterisks indicate comparisons within environment while colored asterisks indicate comparisons within genotype). For statistical models (standard linear regression) and results, see S6 Table.

