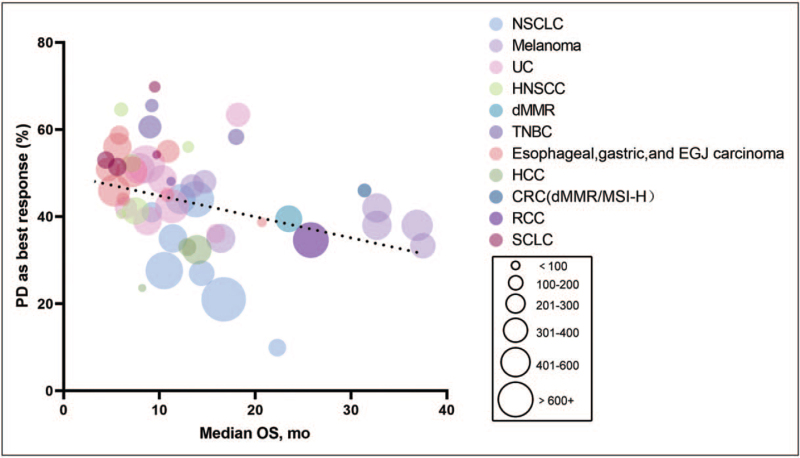
FIGURE 1.
The rate of ‘PD as best response’ and the median overall survival of cancer patients treated with immune checkpoint inhibitors (ICIs). The colored circles represent different tumor types, and the size of the circles represents the number of cancer patients. Trials that did not reach the median overall survival in Table 1 are not included in the figure.

