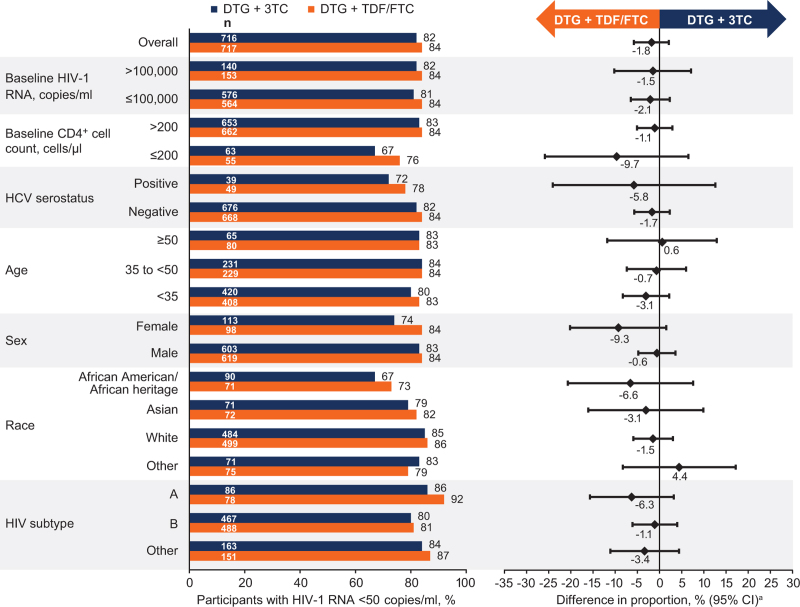
Fig. 2.
Snapshot analysis of the proportion of participants with plasma HIV-1 RNA <50 copies/ml by subgroup in the ITT-E population at week 144.
aAdjusted difference for overall population (DTG + 3TC – DTG + TDF/FTC) and 95% CI are based on a stratified analysis (adjusting for plasma HIV-1 RNA, CD4+ cell count, and study) using Cochran–Mantel–Haenszel weights (meeting noninferiority based on 10% margin); unadjusted difference for subgroups calculated by proportion on DTG/3TC − proportion on DTG + TDF/FTC. CI, confidence interval; 3TC, lamivudine; DTG, dolutegravir; FTC, emtricitabine; HCV, hepatitis C virus; ITT-E, intention-to-treat-exposed; TDF, tenofovir disoproxil fumarate.

