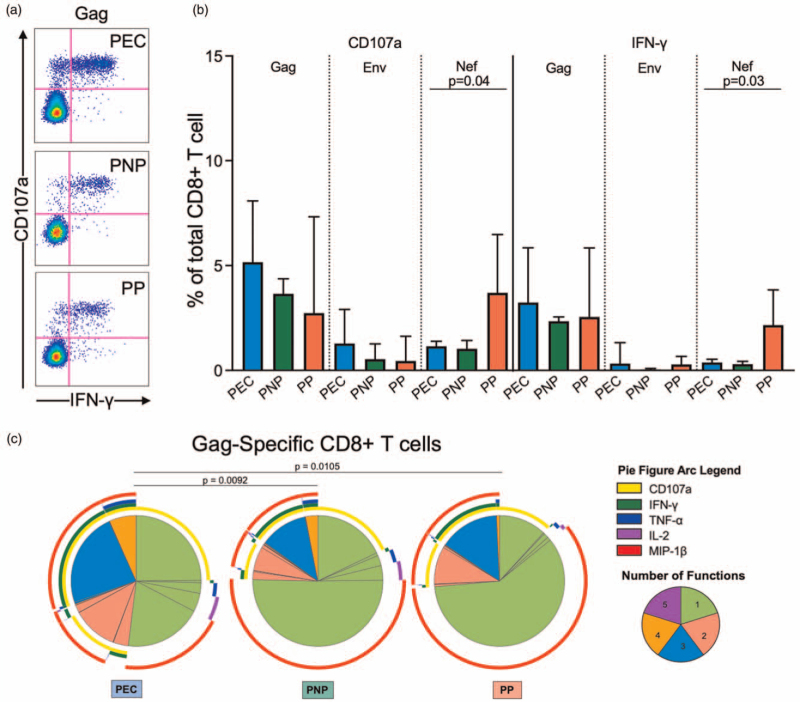
Fig. 4.
HIV-specific response of CD8+ T cells.
(a,b) Representative FACS staining and frequency of CD107a+ and IFN-γ+ CD8+ T cell upon stimulation with Gag, Env, and Nef in pediatric elite controller (PEC), pediatric non-progressor (PNP) and pediatric progressor (PP). (c) Functional profile of Gag-specific CD8+ T cells of each group. Each slice of the pie chart represents the average relative proportions of each possible combination of the functions measured. Slices are colored according to the number of simultaneous functions. The arcs illustrate the specific cytokine response.

