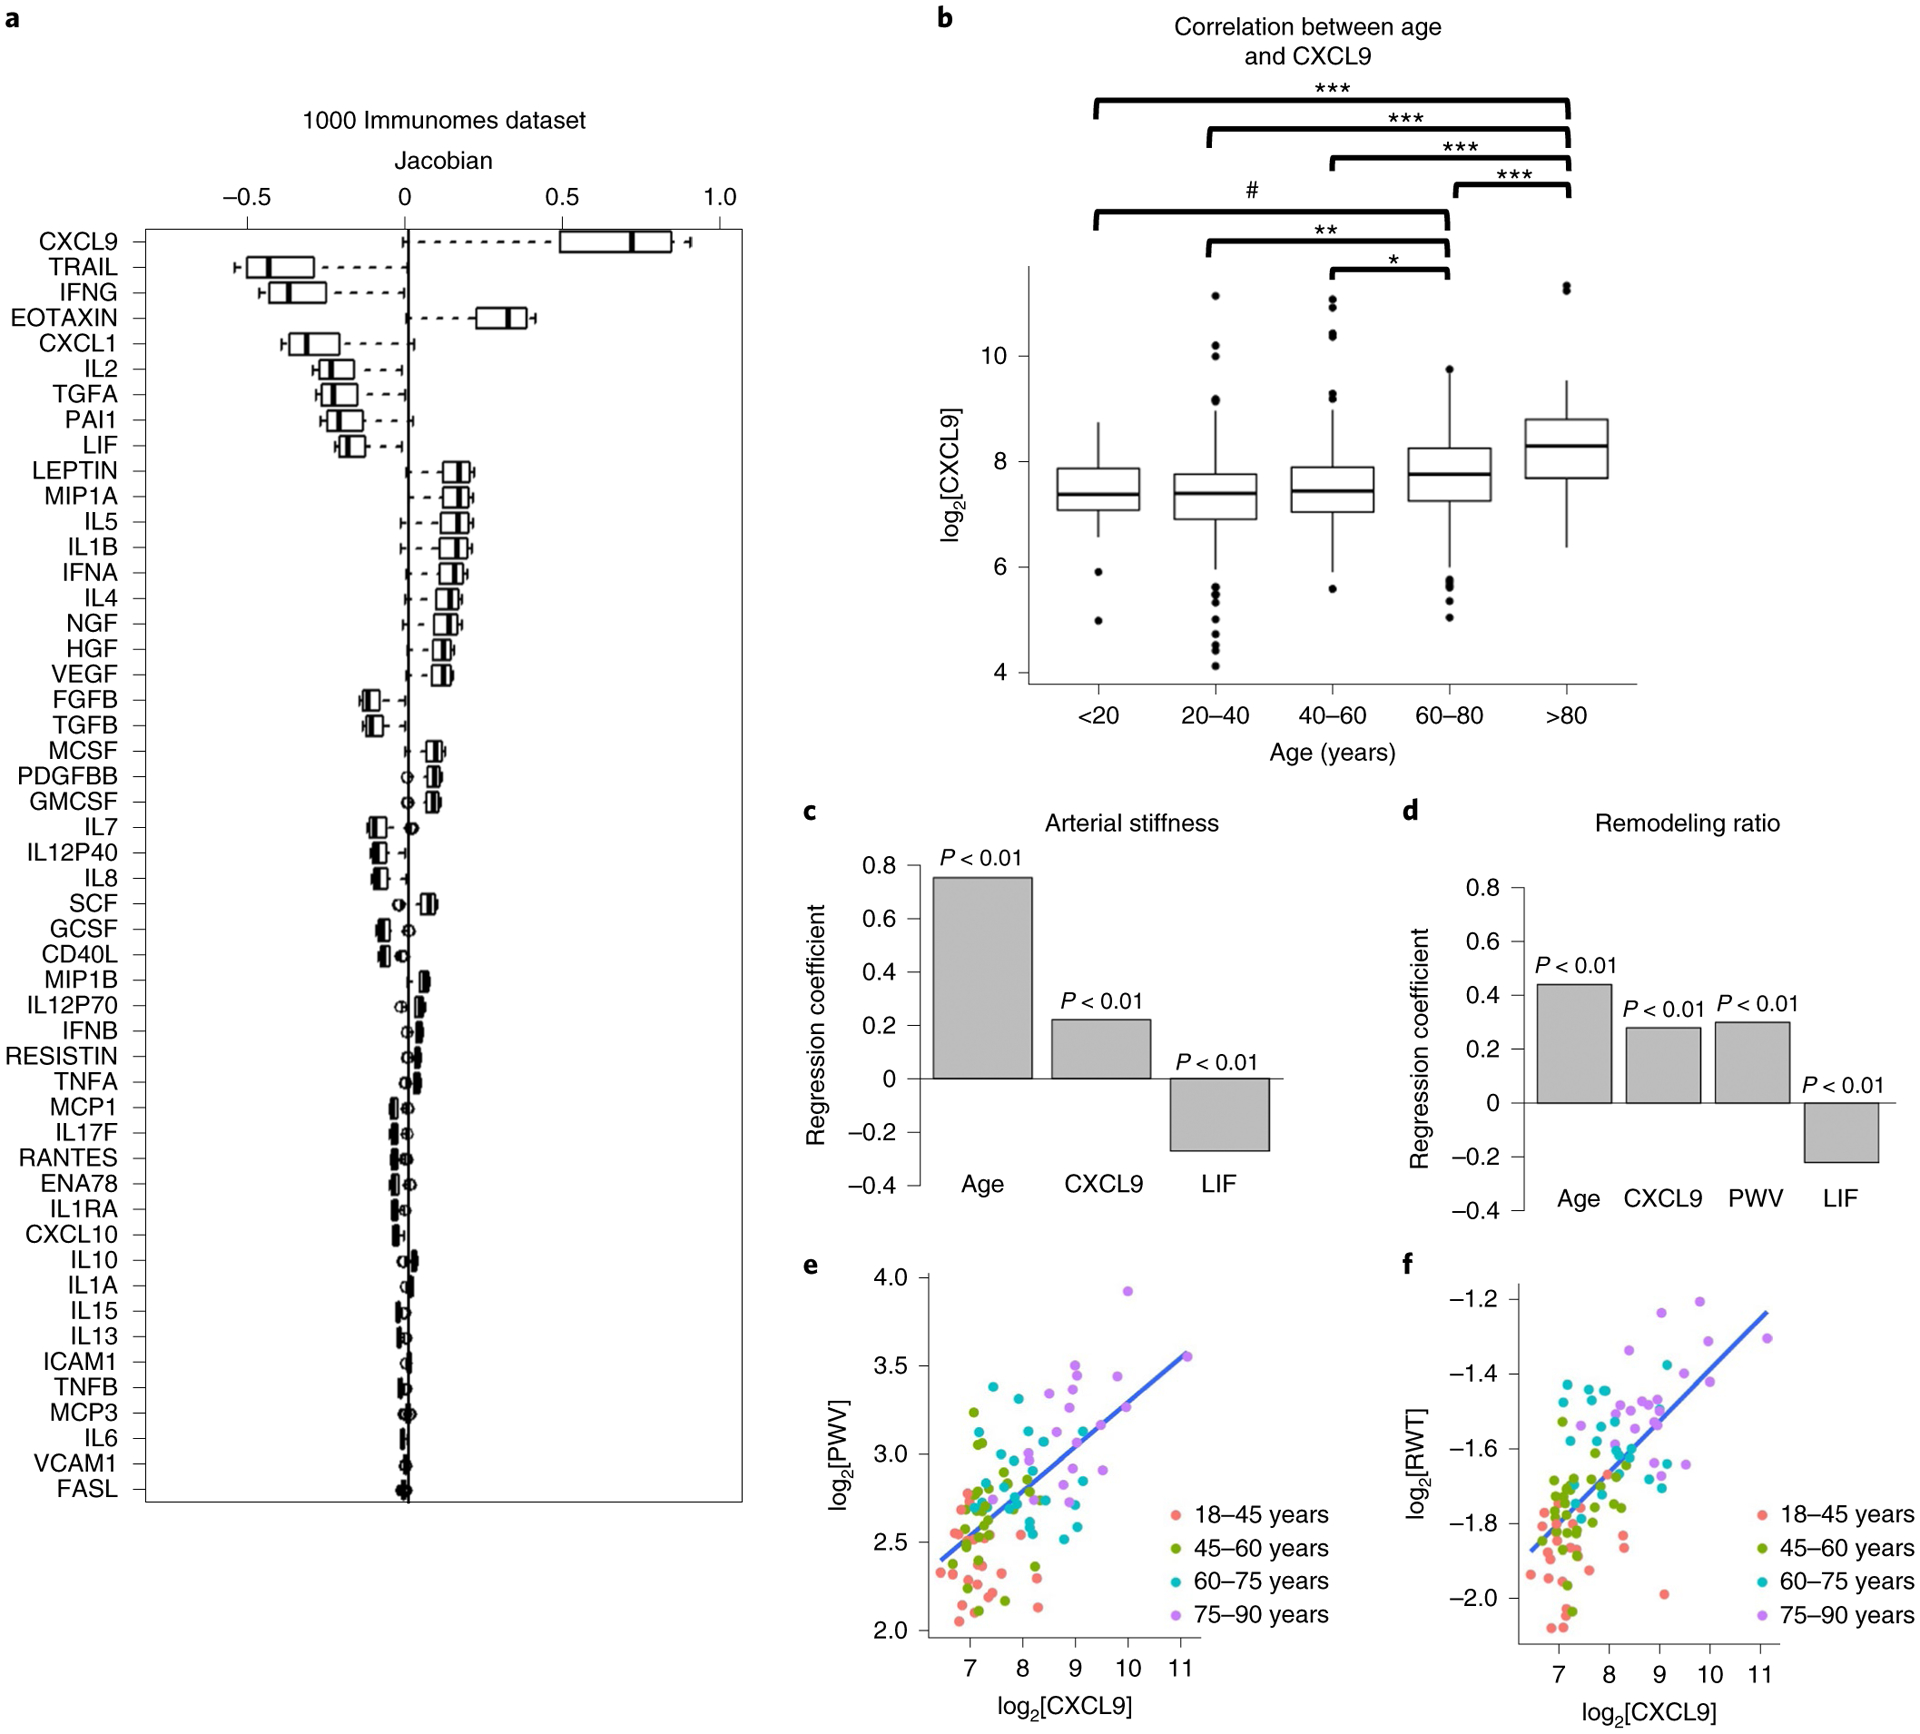
Fig. 3 |. CXCL9 is a major contributor to iAge.

a, Decomposition of the inflammatory score was conducted by estimating the most variable Jacobians (first-order partial derivative of the inflammatory clock). Boxes represent 25th and 75th percentiles around the median (line); whiskers represent 1.5× interquartile range. Both positive and negative contributors to the inflammatory clock are observed. b, The top 15 most variable Jacobians were CXCL9, EOTAXIN, Mip-1α, LEPTIN, IL-1β, IL-5, IFN-α and IL-4 (positive contributors), and TRAIL, IFN-γ, CXCL1, IL-2, TGF-α, PAI-1 and LIF (negative contributors). Significant differences in the levels of CXCL9 were observed between age groups (P < 0.001, by one-way ANOVA). The pairwise differences between groups were evaluated with the Tukey’s honest significant differences test. Significant differences were shown for older age groups (60–80 years and >80 years) and younger age groups (<20 years, 20–40 years, 40–60 years). ***P < 0.001; **P < 0.01; *P < 0.05; #P < 0.1. Exact P values for each pairwise comparisons are as follows: <20 versus 20–40, 0.72; <20 versus 40–60, 0.99; <20 versus 60–80, 0.09; <20 versus >80, 0; 20–40 versus 40–60, 0.13; 20–40 versus 60–80, 3.5 × 10⁻⁶; 20–40 versus >80, 0; 40–60 versus 60–80, 0.023; 40–60 versus >80, 0; 60–80 versus >80, 7.7 × 10⁻⁶. Boxes represent 25th and 75th percentiles around the median (line); whiskers denote 1.5× interquartile range. c,d, In a validation study, 97 healthy adults (aged 25–90 years) well matched for cardiovascular risk factors were selected from a total of 151 recruited participants. Cardiovascular age was estimated using aortic PWV and RWT. Using multiple linear regression analysis after adjusting for age, sex, BMI, heart rate, systolic blood pressure, fasting glucose and total cholesterol to HDL ratio, positive correlations were obtained between CXCL9 and PWV (R = 0.22) and RWT (R = 0.3) (P < 0.01), and negative correlations were observed between LIF and PWV (R = −0.27) (c) and RWT (R = −0.22) (d). P values are derived from hypothesis testing, where the null hypothesis is that the variable has no correlation with the dependent variable. e,f, Direct comparisons between CXCL9 and the two cardiovascular aging phenotypes (PWV (e) and RWT (f)) are depicted. No other variable included in the models had high co-linearity as suggested by variance inflation factors (VIF) <3 for each factor.
