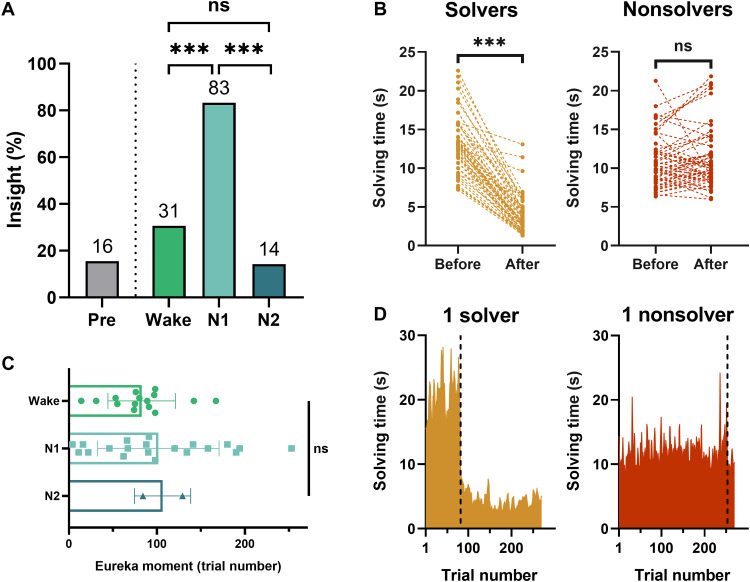
Fig. 2. N1 inspires insight.
(A) Percentage of solvers before sleep (all groups) and after sleep (Wake, N1, and N2 groups defined according to their polysomnographic activity during the break, NPre = 103, Nwake = 49, NN1 = 24, NN2 = 14). (B) Solving time before and after the Eureka moment for all solvers (N = 53) and nonsolvers (N = 50). Each dashed line represents a subject. Note that four solvers did not exhibit a clear shift in performance before and after the identified Eureka moment. They explicitly reported the hidden rule during debriefing and explained that they did not use it as they considered it as cheating. (C) Trial number at which the Eureka moment occurs during the Post phase. (D) Illustration of the Eureka moment (dark dashed line) automatically detected by an algorithm that identifies where the most abrupt change in solving time lies for both a solver (left) and a nonsolver (right). ***P < 0.001; n.s. for nonsignificant differences (Fisher test for comparisons of proportions between groups, Wilcoxon signed-rank test for comparisons between two paired samples: solvers and nonsolvers, and Kruskal-Wallis test for comparisons between all three groups).

