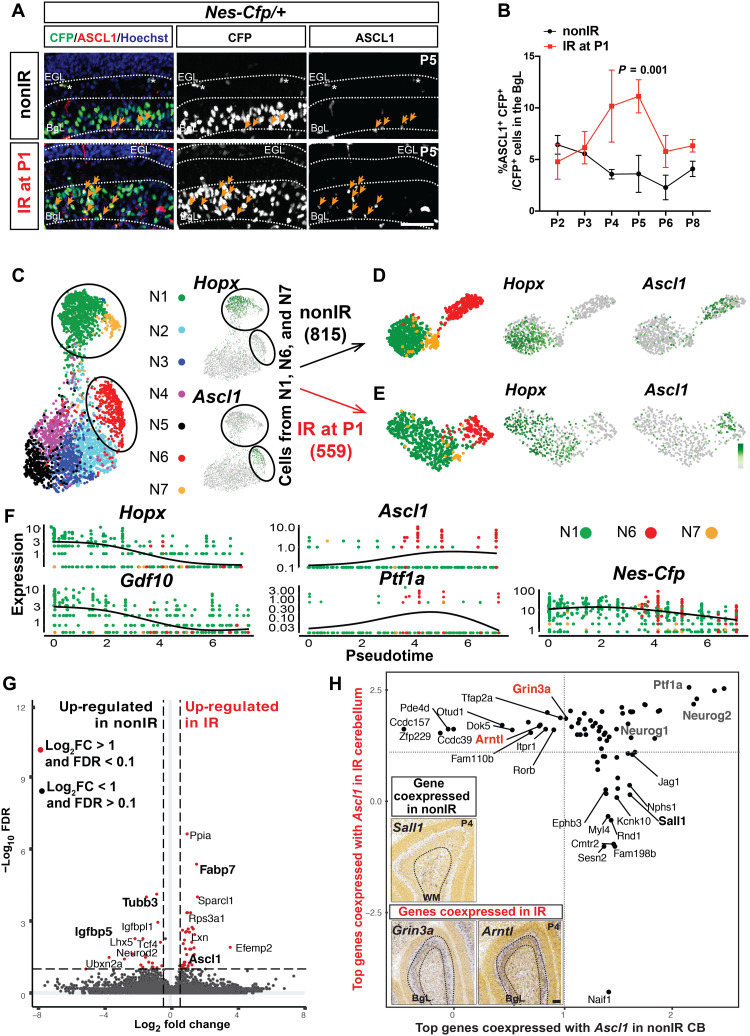
Fig. 3. Transcriptional programs of Ascl1+ NEPs diverge between nonIR and IR conditions and a transitory Ascl1+ transitory cell state emerges upon injury.
(A) IF analysis for ASCL1 and CFP on P5 nonIR and IR Nes-Cfp cerebella. (B) Quantification of percentage of ASCL1+ CFP+ cells in the BgL at P2 to P6 and P8 in nonIR and IR Nes-Cfp cerebella [two-way analysis of variance (ANOVA), F(1,15) = 25.75, P = 0.0001]. (C to E) UMAP showing subclustering of the nonIR (B) and the IR (C) cells from clusters N1, N6, and N7 (circled; Fig. 1F). (F) Pseudotemporal ordering of the IR NEPs from N1, N6, and N7 using Monocle3. Cells are colored on the basis of their original cluster identity shown in (C). Expression levels of marker genes Hopx, Gdf10 (astroglia), Ascl1, Ptf1a (neurogenic), and Nes-Cfp (pan-NEP) are plotted with respect to pseudotime. (G) Volcano plot showing the differentially expressed genes [fold change (FC)] obtained from the comparison of the nonIR cells to the IR cells in cluster N6 (Ascl1-enriched NEPs; table S6). (H) Analysis of the genes that are most likely to be coexpressed with Ascl1 in the nonIR and IR NEPs. Quadrants represent whether a gene is coexpressed only in the nonIR cells (lower right) or IR cells (upper left) or in both condition (top right). Insets show Allen Brain Atlas RNA in situ analysis for Sall1, Grin3a, and Arntl in the P4 cerebellum. Scale bar, 50 μm.

