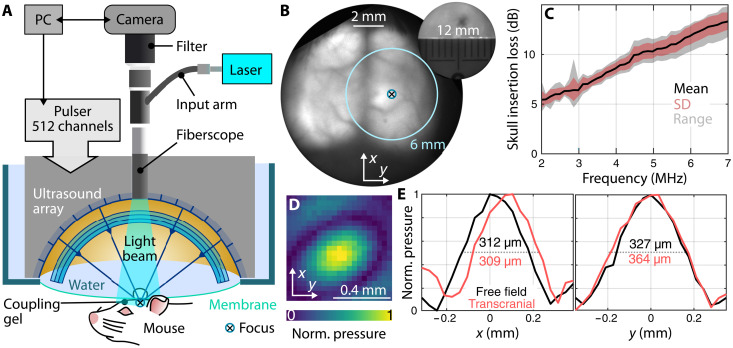
Fig. 1. Experimental setup and characterization.
(A) Schematic of the integrated wide-field fluorescence imaging and high-precision transcranial ultrasound system FLUS. (B) Fluorescence image of a mouse brain expressing GCaMP6f through the intact scalp and skull. A crosshair indicates the position of the array’s focus and the 6-mm circle the extent of the three-dimensional focus- steering range. The inset shows the extent of the field of view. (C) Skull insertion loss [mean, standard deviation (SD), and range] as a function of frequency measured using a hydrophone. (D) Normalized ultrasound pressure measured transcranially at 3 MHz. (E) Focal spot size at 3 MHz in free field (without the skull) and with the mouse skull in the ultrasound propagation path.

