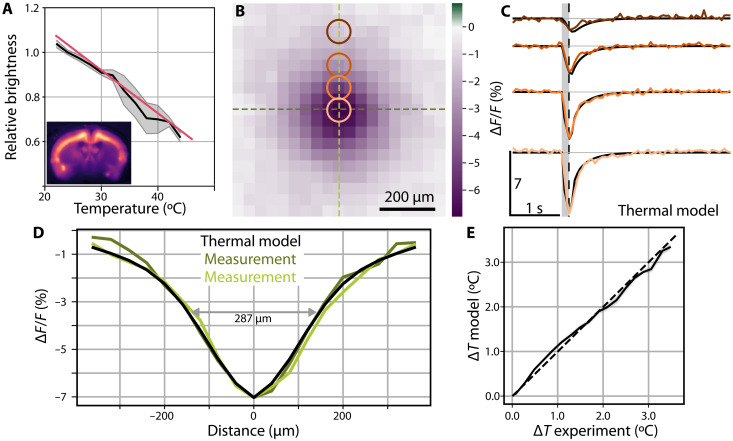
Fig. 3. Average fluorescence dip characterization with a thermal model.
(A) Change in fluorescence as a function of the temperature in a brain slice expressing GCaMP6f. An affine fit to four brain slices yields a fluorescence change of −1.9 ± 0.7%/°C. (B) Average fluorescence dip (n = 7, 140 stimulation cycles) at the instant of the minimum fluorescence. (C) Time traces of the average dip compared with the thermal model from the bioheat equation labeled following the rings on (B). The gray region depicts the instant of the FUS delivery, while a dashed vertical line indicates the time instant shown in (B). (D) Characterization of the spatial extent of the fluorescence dip compared against the thermal model. Dark and light green experimental curves correspond to cross sections of the same colors in (B). (E) Inferred relative temperature change for the model and the measured data. Gray region depicts the SEM, whereas the dashed line shows the identity map.

