
FIGURE 3.
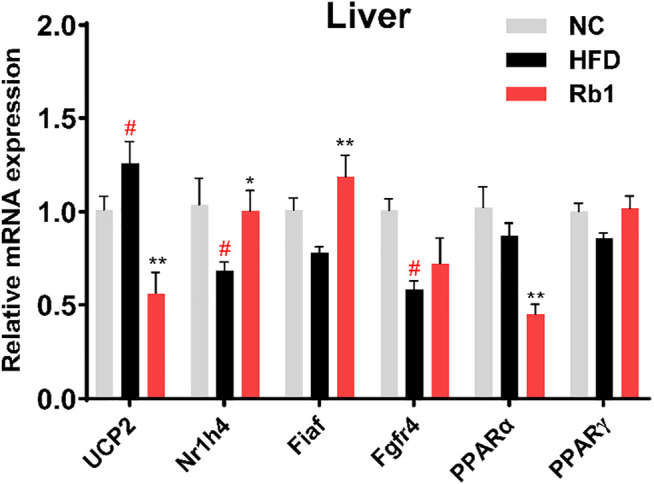
mRNA expression of genes involved in liver were detected by RT-qPCR. Relative expression was calculated using the 2ΔΔCT method with chow mice as the group of reference and GADPH as reference gene. The data are expressed as the mean ± SEM; n = 6; one-way analysis of variance with Tukey’s post-hoc test. # p < 0.05, ## p < 0.01, for NC vs HFD; * p < 0.05, ** p < 0.01 for Rb1 vs HFD.