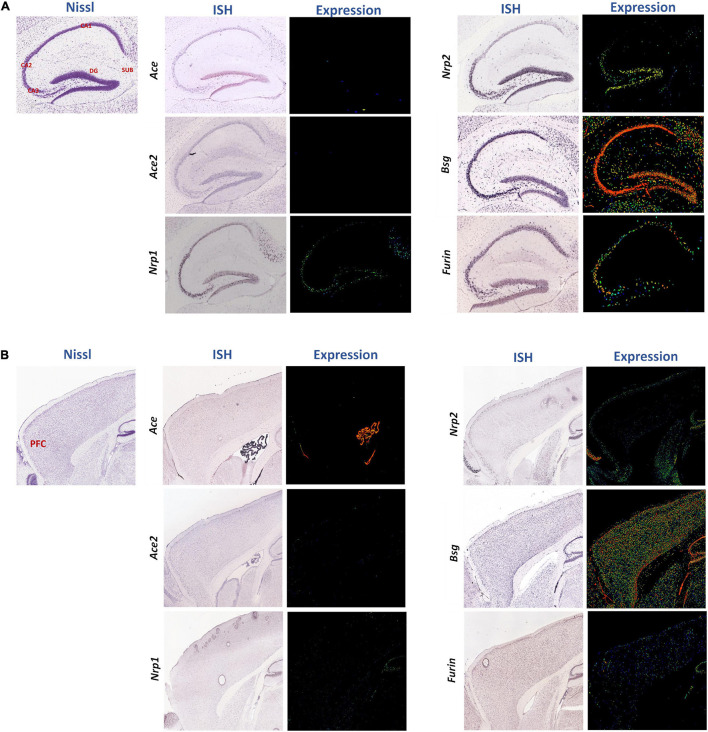
FIGURE 3.
Spatial distributions of the SARS-CoV-2 receptors in the sagittal sections of mouse hippocampus and PFC region. Spatial distributions of the SARS-CoV-2 receptors Ace, Ace2, Nrp1, Nrp2, Bsg, and Furin in the mouse hippocampus (A) and cerebral cortex region (B) were studied. In representative Nissl images, the cornu ammonis (CA)1, CA2, CA3, dentate gyrus (DG), and subiculum (SUB), and PFC are labeled in red. The middle and right columns represent ISH and pseudo-colored expression images, respectively. Blue, green, and red pseudo-colors encode staining intensities (low, medium, and high) in expression images, respectively. All images were downloaded from the Allen Mouse Brain Atlas (©2004 Allen Institute for Brain Science) (Lein et al., 2007).

