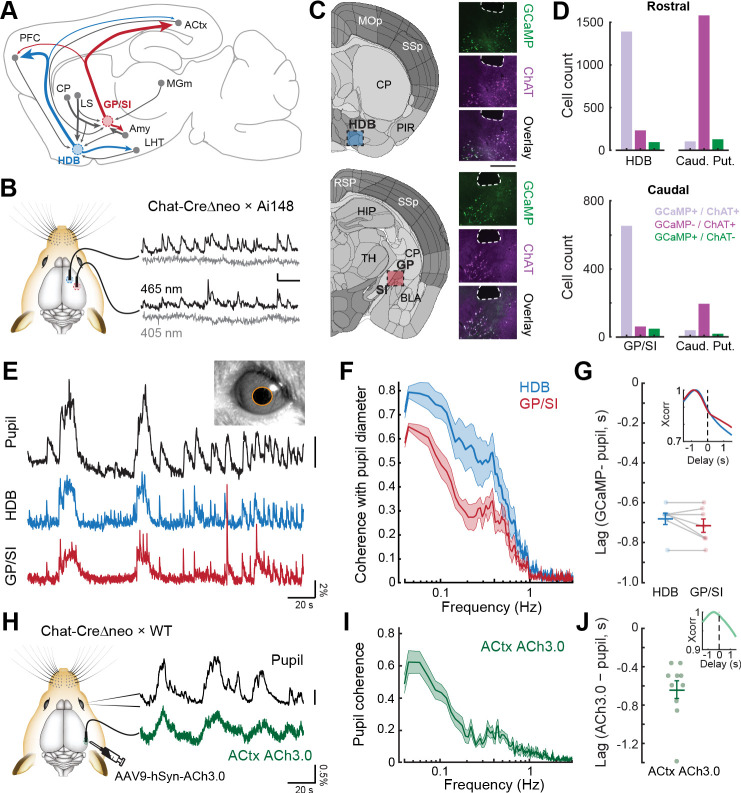
Figure 1. Bulk basal forebrain cholinergic neuron (BFCN) activity and cortical acetylcholine release closely correspond with pupil-indexed global brain state.
(A) Mid-sagittal diagram of the mouse brain depicting the diversity in major inputs (gray) and outputs (colored) between a rostroventral basal forebrain structure, the horizontal limb of the diagonal band of Broca (HDB), and the caudodorsal tail of the basal forebrain, the boundary of the globus pallidus and substantia innominata (GP/SI). ACtx = auditory cortex, MGm = medial subdivision of the medial geniculate body, LHT = lateral hypothalamus, Amy = amygdala, LS = lateral septum, CP = caudate putamen, PFC = prefrontal cortex. (B) Dual bulk fiber-based calcium imaging from basal forebrain cholinergic neurons was performed from the HDB and GP/SI of ChAT-Cre-Δneo × Ai148 mice. Dual wavelength imaging allowed separate visualization of calcium-independent fluorescence (405 nm) from calcium-dependent fluorescence (465 nm). Vertical and horizontal scale bars reflect 1% DF/F and 5 s, respectively. (C) Coronal diagrams are adapted from the adult mouse coronal reference atlas created by the Allen Institute for Brain Science. Diagrams illustrate anatomical landmarks at the rostral (top) and caudal (bottom) imaging locations. Post-mortem fluorescence photomicrographs of brain sections immunolabeled for the ChAT protein depict the outline of the fiber path and the position of HDB, GP, and SI. GCaMP and ChAT fluorescence channels and their overlay to illustrate the strong co-localization of GCaMP in ChAT neurons within HDB and GP/SI regions near the fiber tip. Scale bar = 0.5 mm. (D) Cells from regions of interest below the fiber tip were counted based on their expression of GCaMP-only (green), ChAT-only (magenta), or both GCaMP and ChAT (lavender). The same analysis was performed on cells within the caudate putamen of the dorsal striatrum. Numbers indicate the number of neurons in the corresponding category. (E) Isoluminous spontaneous pupil dilations in an example mouse were visualized in combination with GCaMP imaging from HDB and GP/SI. Pupil scale bar depicts a five pixel2 areal change. (F) Mean ± SEM coherence of HDB and GP/SI GCaMP activity with pupil-indexed brain state in isoluminous conditions without any explicit environmental stimuli or task demands. N = 7 mice provided data for pupil, HDB, and GP/SI. Basal forebrain GCaMP signals closely track slow (<0.5 Hz) changes in pupil diameter, though the correspondence is stronger overall in HDB than in GP/SI (two-way repeated measures ANOVA, main effect for brain structure, F = 12.58, p = 0.01). (G) HDB and GP/SI GCaMP changes lead pupil fluctuations by approximately 0.7 s. Inset: Cross-correlation of the HDB and GP/SI GCaMP signals with pupil fluctuations. Individual data points depict the time value corresponding to the peak of the cross-correlograms from individual mice. Mean ± SEM values are provided at left and right. (H) Tapered fiber imaging of the ACh3.0 fluorescence during pupil videography. Scale bar depicts a five pixel diameter change. (I) Mean ± SEM coherence of ACtx ACh3.0 with pupil-indexed arousal in isoluminous conditions without any explicit environmental stimuli or task demands. N = 10 mice. Pupil coherence was qualitatively similar to GP/SI GCaMP coherence, which is expected on account of its stronger anatomical projection to ACtx. (J) ACtx ACh3.0 changes lead pupil fluctuations by approximately 0.6 s. Inset: Cross-correlation of the ACtx ACh3.0 signal with pupil fluctuations. Individual data points depict the time value corresponding to the peak of the cross-correlograms from individual mice. Mean ± SEM values are provided at left and right.


