. 2021 Nov 25;10:e63678. doi: 10.7554/eLife.63678

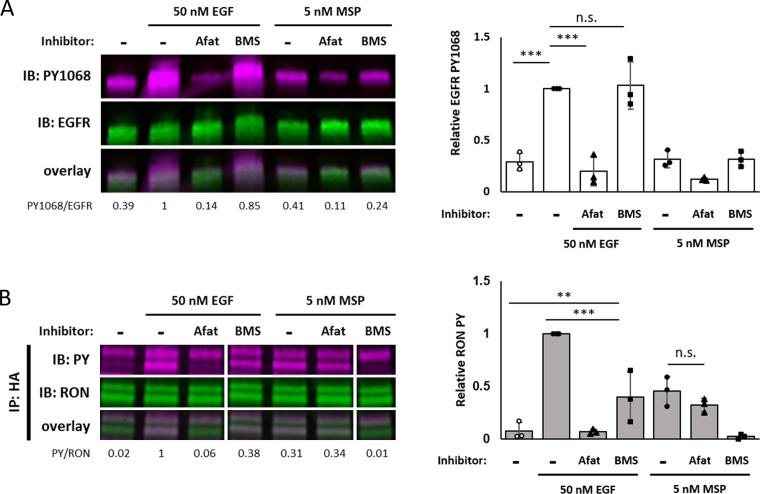
Figure 5. Maximal EGF-induced RON phosphorylation requires kinase activity of both receptors.

(A and B) A431RON cells were pre-treated with 10 μM afatinib (Afat, pan-ErbB inhibitor) or 1 μM BMS777607 (BMS, Met family kinase inhibitor) for 20 or 15 min, respectively. Cells were then treated ± EGF or MSP for 5 min. (A) Cell lysates were used for PY1068 and EGFR immunoblots. (B) Lysates were immunoprecipitated (IP) with an anti-HA antibody and then immunoblotted for PY and RON. All samples are from the same blot, but an extraneous lane was removed for clarity. Bar graphs are corresponding mean ± SD from triplicate biological experiments. * p < 0.05; ** p < 0.01; *** p < 0.001.

Figure 5—source data 1. Full raw western blots and blots with relevant bands labelled, corresponding to Figure 5A,B.
Figure 5—source data 2. Source data for quantification of blots in Figure 5A,B.

Figure 5.

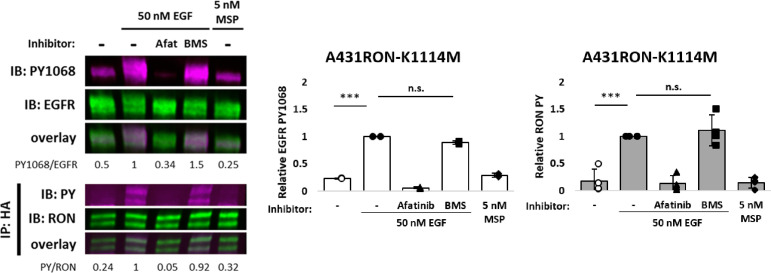
Figure 5—figure supplement 1. A431RON-K1114M (RON kinase-dead) cells were pre-treated, where indicated, with afatinib (Afat; pan-ErbB inhibitor) or BMS777607 (BMS; Met family kinase inhibitor) for 20 or 15 min, respectively.

Figure 5—figure supplement 1.

Cells were subsequently treated with EGF or MSP for 5 min and lysed for immunoblot analysis. For RON and phospho-RON immunoblotting, lysates were IP with an anti-HA antibody (RON) and whole cell lysates used for EGFR and EGFR-PY1068, and their respective overlays. Triplicate experiments for EGFR (white bars) and RON (grey bars) phosphorylation are plotted as mean ± SD. *** p < 0.001.
Figure 5—figure supplement 1—source data 1. Full raw western blots and blots with relevant bands labelled, corresponding to Figure 5—figure supplement 1.
Figure 5—figure supplement 1—source data 2. Source data for quantification of blots in Figure 5—figure supplement 1.
Figure 5—figure supplement 2. A431RON or A431RON-K1114M cells were treated ± EGF for 5 min before imaging.
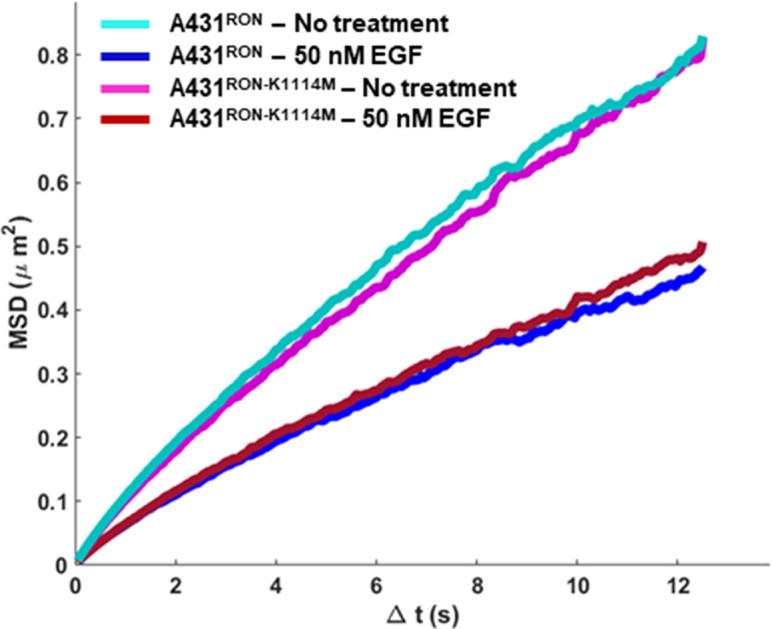
Figure 5—figure supplement 2.

RON diffusion was tracked using QD605-HA-RON and measured over time, displayed as an ensemble mean squared displacement (MSD) plot. A reduction in slope of the MSD indicates a reduced mobility.