Figure 1. Insulin-induced hypoglycemia enhances population activity of AVP neurons in the supraoptic nucleus (SON), driving glucagon secretion AAV-DIO-hM3Dq-mCherry was injected bilaterally into the SON of Avpires-Cre/+ mice.
CNO (3 mg/kg) or vehicle was injected i.p. In the same cohort (different trial), LY2409021 (5 mg/kg) or SSR149415 (30 mg/kg) was injected (i.p.) 30 min prior to CNO. See Figure 1—figure supplement 1. (a) Blood glucose measurements from (a). Two-way RM ANOVA (Tukey’s). CNO 0 min versus CNO at 15, 30, and 60 min; p<0.05=*, p<0.01=**. Comparison of CNO versus Saline, CNO+LY2409021 or CNO+SSR149415 at 30 min; p<0.01=††. Time, p<0.0001; Treatment, p=0.0006; Interaction, p<0.0001. n=6 mice. (b) Terminal plasma copeptin 30 min following saline or CNO injection. Mann-Whitney t-test (p=0.0025, **). n=15–18 mice. (c) Plasma glucose during an insulin tolerance test (ITT; 0.75 U/kg) in n=5 wild-type mice. (d) Plasma glucagon following an ITT. n=5 wild-type mice. Paired t-test, p<0.01=**. (e) Glucagon secretion from the perfused mouse pancreas. Glucagon released during all time points in 8 mM glucose was not significantly different from 4 mM glucose (all p>0.8). Right: area under curve. Paired t-test, ns=not significant. (f) Glucagon secretion from isolated mouse islets during 60 min static incubation at indicated glucose concentrations. n=7 wild-type mice. One-way ANOVA with Tukey post-hoc. 4 mM versus 8 mM glucose, p=0.99. (g) Measurements of population GCaMP6s activity in pituitary-projecting AVP neurons in the SON. Inset: Expression of GCaMP6s in AVP neurons in the SON. Arrow=tip of the optic fiber. (h) Simultaneous in vivo fiber photometry of AVP neuron activity (GCaMP6) and continuous glucose monitoring (black line) in response to an ITT (1 U/kg). Dashed gray line indicates the time of insulin injection. (i) Same animal as in (j), but for saline vehicle injection (dashed gray line). (j) GCaMP6s signal (normalized) in response to insulin (n=6 mice) or saline vehicle (n=6). Plasma copeptin at 30 min following saline or insulin. Mann-Whitney U-test, p=0.021. n=15–18 mice. AVP, arginine-vasopressin.

Figure 1—figure supplement 1. Effects of CNO in animals expressing mCherry in supraoptic nucleus (SON) AVP neurons (a) AAV-DIO-hM3Dq-mCherry was injected into the SON of Avpires-Cre/+ mice.

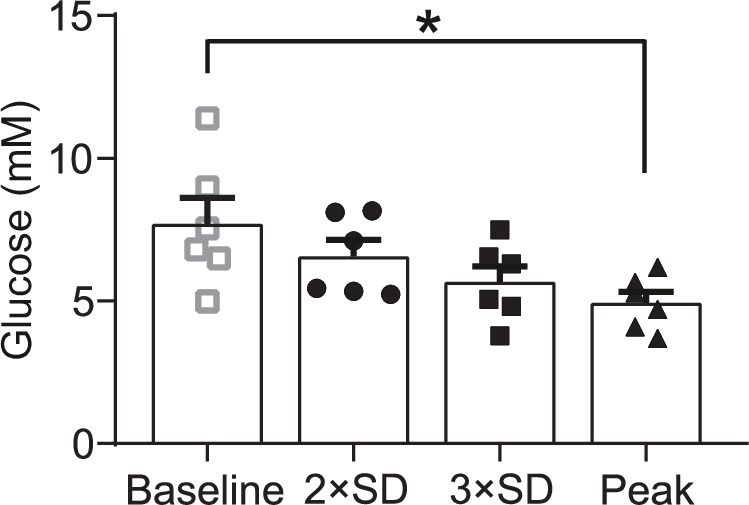
Figure 1—figure supplement 2. Simultaneous continuous glucose monitoring (CGM) and in vivo fiber photometry of AVP neurons Grouped analysis of the glucose value at which the GCaMP6 signal crosses >2 SD from baseline, >3 SD from baseline and first exhibits a peak.