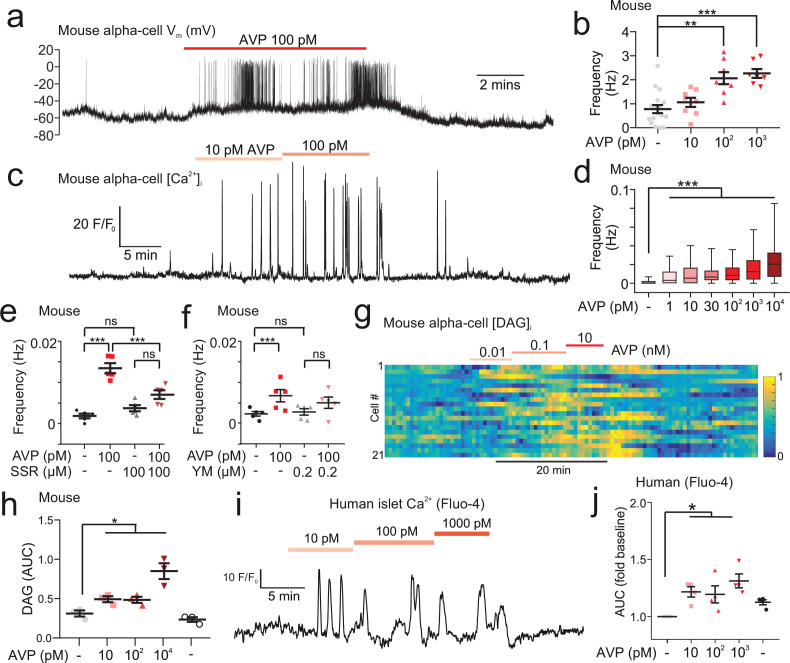
Figure 3. AVP increases action potential firing, Ca2+ activity, and intracellular DAG in alpha-cells in intact islets.
(a) Membrane potential (Vm) recording (perforated patch-clamp) of an alpha-cell in response to 100 pM AVP. (b) Frequency-response curve for varying concentrations of AVP (17 alpha-cells, 10 Gcg-GCaMP3 mice). Mixed-effects analysis of variance, Holm-Sidak’s post-hoc (p<0.01=**; p<0.001=***; p=0.073 for 3 mM glucose vs. 10 pM AVP). (c) GCaMP3 signal from an alpha-cell in response to AVP. (d) Box and whisker plot of the frequency of GCaMP3 oscillations in response to AVP. 142–170 alpha-cells, 7 islets, n=7 Gcg-GCaMP3 mice. Recordings in 3 mM glucose. One-way RM ANOVA, p<0.001=***. (e) Frequency of GCaMP3 oscillations in response to 100 pM AVP in the presence and absence of SSR149415 (10 µM). 75–90 alpha-cells, 6 islets, n=5 Gcg-GCaMP3 mice. Recordings in 3 mM glucose. One-way ANOVA (Tukey), p<0.001=***, ns=not significant (p>0.2). (f) Frequency of GCaMP3 oscillations in response to 100 pM AVP in the absence and presence of YM-254890 (0.2 µM). 75–90 alpha-cells, 6 islets, n=5 GcgCre/+:GCaMP3/+ mice. Recordings in 3 mM glucose. One-way RM ANOVA (Tukey’s multiple comparisons test), p<0.05=*, ns=not significant (p>0.3). AVP versus AVP+YM-254890; p=0.99. (g) Heatmap of intracellular diacylglycerol (DAG; upward DAG) signal from single islet cells (dispersed into clusters) in response to AVP. The signal was median filtered and normalized to largest signal in the recording. (h) Area under curve (AUC, normalized to duration) for DAG signal for each experimental condition. 10 recordings, 152 cells, n=3 wild-type mice. One-way RM ANOVA, p<0.05=* (Tukey’s multiple comparisons test). (i) Fluo4 signal from a putative alpha-cell in a human islet in response to AVP (10, 100, and 1000 pM). Recording in 3 mM glucose. (j) Area under curve (AUC, normalized to duration) for Fluo4 signal in each human islet, for each experimental condition. 26 islets, n=4 human donors. One-way ANOVA, p<0.05=* (Sidak). AVP, arginine-vasopressin.

