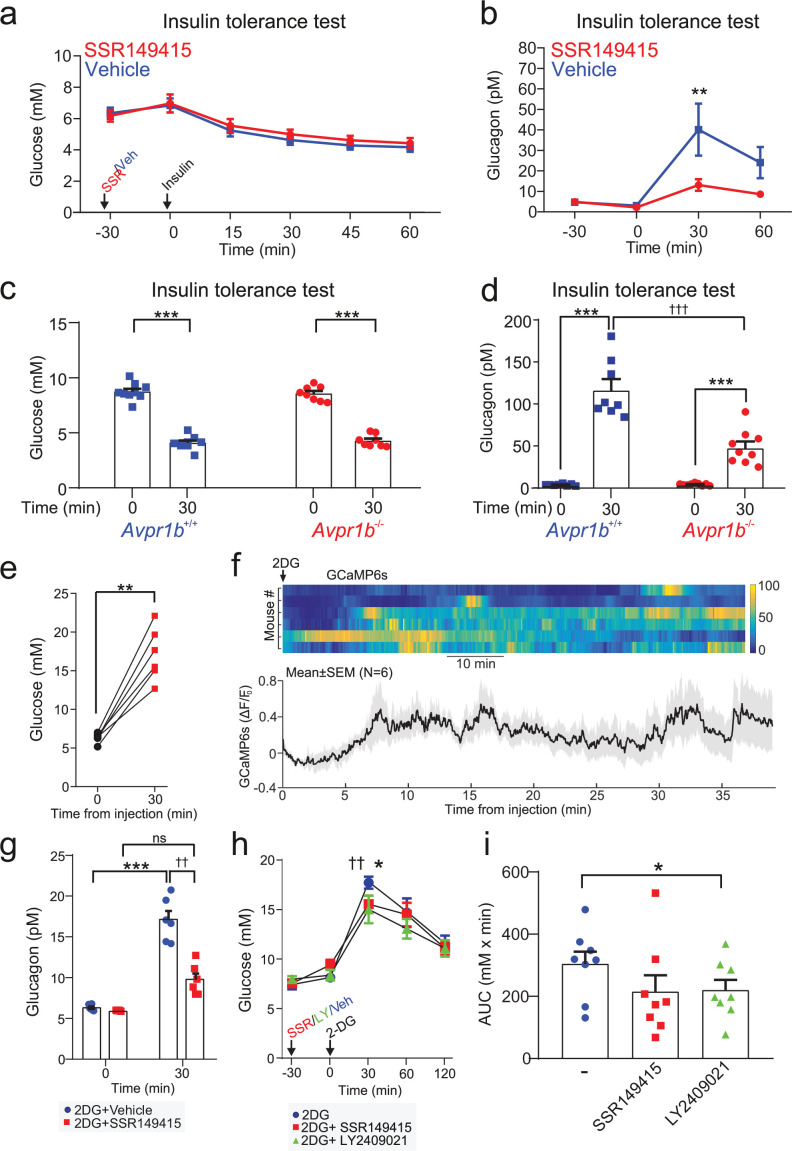
Figure 4. The vasopressin 1b receptor mediates hypoglycemia-induced glucagon secretion.
(a) Blood glucose during an ITT (0.75 U/kg; injection at 30 min). 30 min prior to the commencement of the ITT (t=0 min), either the V1bR antagonist SSR149415 (30 mg/kg) or vehicle was administered i.p. n=7 wild-type mice. (b) Plasma glucagon for (a). Two-way RM ANOVA with Sidak’s (between conditions) and Tukey’s (within condition) multiple comparisons test. Vehicle versus SSR149415; p<0.01=†† (30 min) and p<0.05=† (60 min). Glucagon was increased in response to an ITT in both treatment groups (p<0.01=** vs. 0 min). n=6–7 wild-type mice. (c) Plasma glucose during an ITT (0.75 U/kg; injection at 0 min) in Avpr1b−/− mice and littermate controls (Avpr1b+/+). Two-way RM ANOVA (Tukey), p<0.001=***. n=8–9 mice. (d) Plasma glucagon for (c). Two-way RM ANOVA (Sidak). Avpr1b−/− versus Avpr1b+/+; p<0.001=††† (30 min). 0 min versus 30 min; p<0.001=***. n=8–9 mice. (e) Population GCaMP6s activity in pituitary-projecting AVP neurons in the supraoptic nucleus (SON). GCaMP6s was imaged in response to 2-Deoxy-D-glucose (2DG, 500 mg/kg) injection (i.p.). Plasma glucose at baseline (0 min) and 30 min after 2DG injection. Paired t-test, p<0.01=**. n=6 mice. (f) Upper: heatmap of population activity (GCaMP6s) response to 2DG for each mouse (n=6). Lower: mean ± SEM GCaMP6s signal for all mice (n=6) in response to 2DG. GCaMP6s data represented as (F–F0)/F0. (g) Plasma glucagon following 2DG injection (at 0 min). Prior to 2DG, either SSR149415 or vehicle was administered i.p. Two-way RM ANOVA by both factors (Bonferroni). Vehicle versus SSR149415; p<0.01=†† (30 min); p>0.99 (0 min). 0 min versus 30 min; p=0.009 (Vehicle); p=0.093 (SSR149415). Time, p<0.0001; Treatment, p=0.002; Interaction, p=0.005. n=6 mice. (h) Blood glucose response to 2DG, with or without pretreatment with SSR149415 (30 mg/kg), LY2409021 (5 mg/kg), or saline vehicle. Antagonists/vehicle injected 30 min prior to 2DG. Two-way RM ANOVA with Sidak’s multiple comparison test; 2DG versus 2DG+SSR149415, p=0.0103 (*); 2DG versus 2DG+LY024091, p=0.0047 (††). (i) Area under the (glucose) curve (AUC). One way ANOVA; 2DG versus 2DG+LY024091, p<0.05 (*). ITT, insulin tolerance test.

