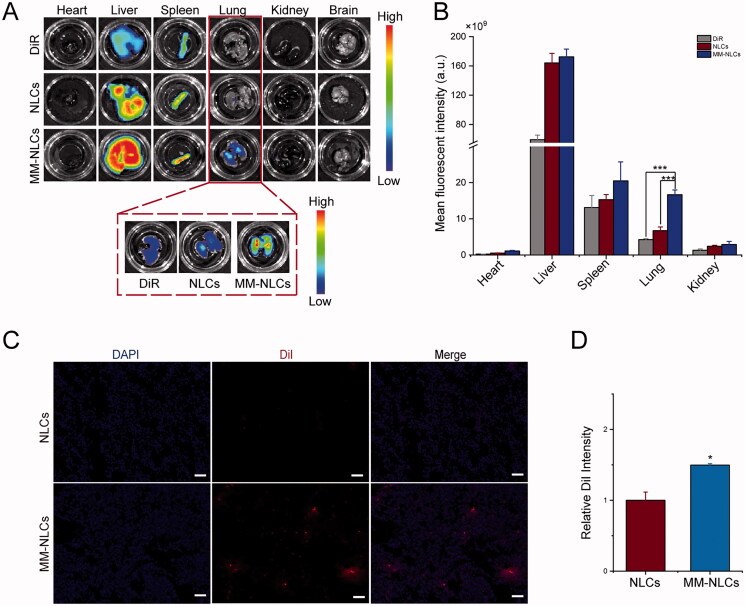
Figure 5.
In vivo targeting evaluation. (A) Representative ex vivo fluorescence images and (B) quantitative data of DiR fluorescent signals accumulated in lung at 24 h (n = 3, mean ± SD, ***p < .001). (C) CLSM images of accumulated MM-NLCs in lung at 12 h (scale bar = 50 μm). (D) ImageJ was utilized to quantify the distribution of NLCs and MM-NLCs in lung (n = 3, mean ± SD, *p < .05).

