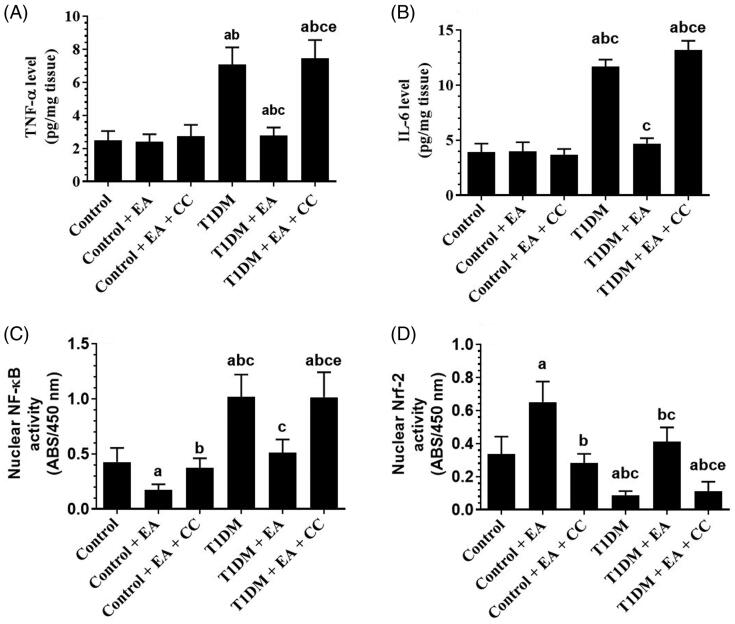
Figure 4.
Levels of inflammatory markers and nuclear activities of NF-κB and Nrf2 in the livers of all groups of rats. Data are presented as the mean ± SD for n = 8 rats/group. Significance was determined at p < 0.05. a: significantly different as compared to control; b: significantly different as compared to control + ellagic acid (EA); c: significantly different as compared to control + EA + compound C (CC, and AMKP inhibitor); d: significantly different as compared to T1DM-induced rats; and e: significantly different as compared to T1DM + EA-treated rats.

