
Figure 2.
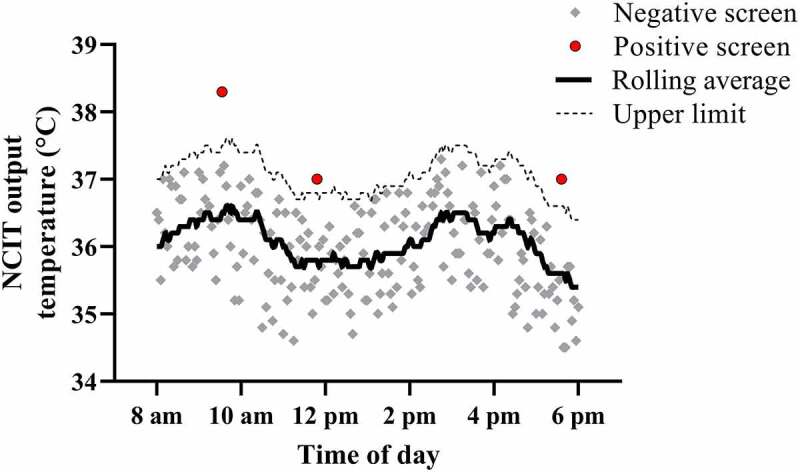
Simulated data to show the relative temperature screening method. A rolling average (solid black line) of all data points is used as the reference temperature. A temperature threshold of 1°C above this rolling average (dashed line) would result in a positive temperature screen, as shown by the red circular symbols. All data points below this threshold (gray symbols) would screen negative