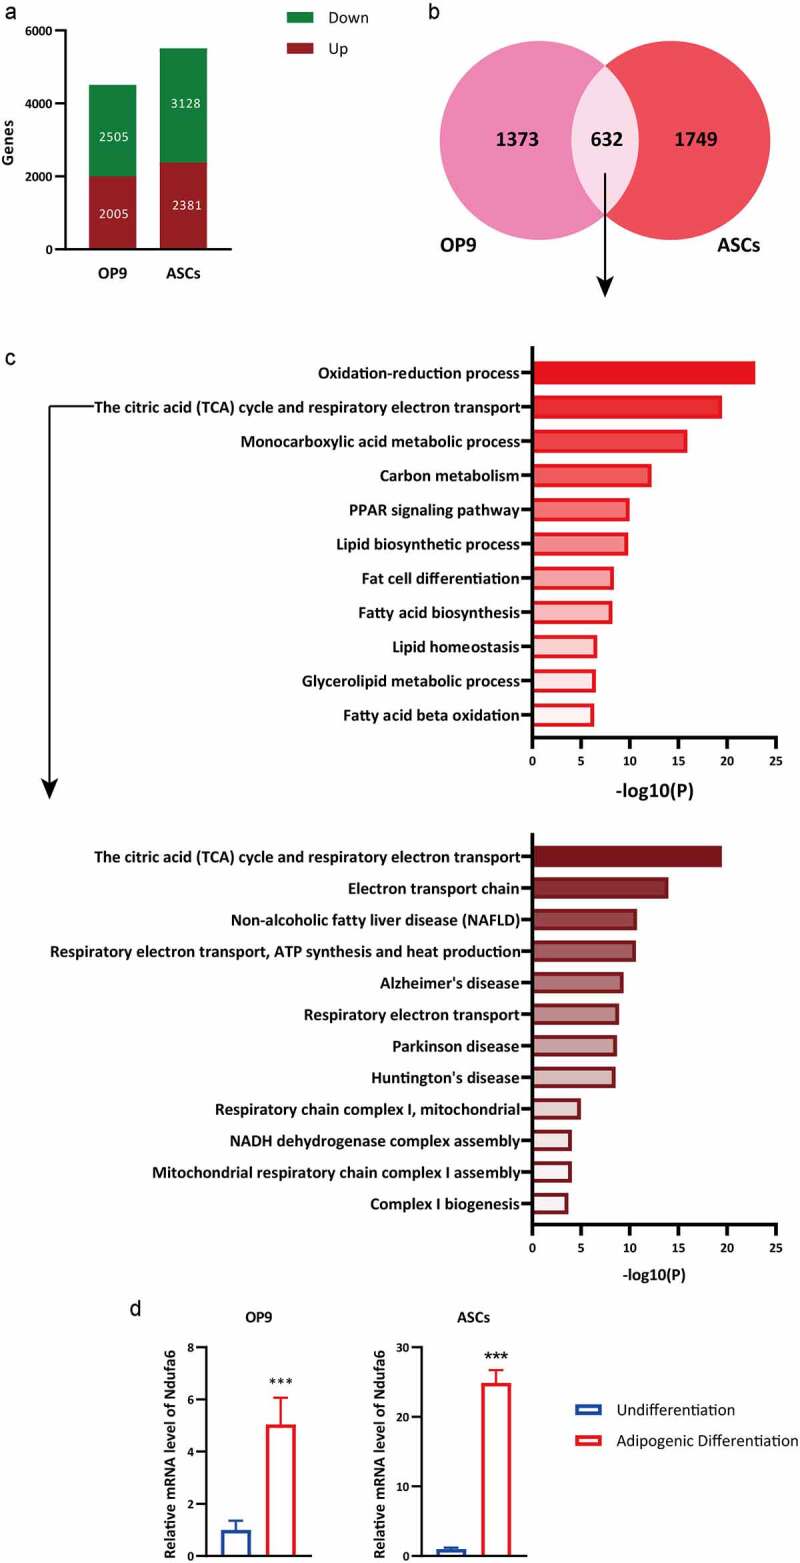
Figure 1.

RNA-Seq analysis of undifferentiated and differentiated OP9 and ASCs. RNA-Seq data were obtained from OP9 cells and ASCs with or without adipogenic differentiation. (a) The numbers of up- and downregulated genes in OP9 and ASCs after adipogenic differentiation were selected. (b) The Venn diagram illustrates the number of upregulated genes and common upregulated genes in OP9 and ACSs after adipogenic differentiation. (c) GO analysis of common upregulated genes in OP9 and ASCs after adipogenic differentiation. GO, gene ontology. (d) The relative mRNA level of Ndufa6 in OP9 cells and ASCs with or without adipogenic differentiation was tested with RT–qPCR (n = 3). Values are presented as the mean ± standard deviation. Statistical analysis was performed by the LSD t-test. * P < 0.05; ** P < 0.01; *** P < 0.005
