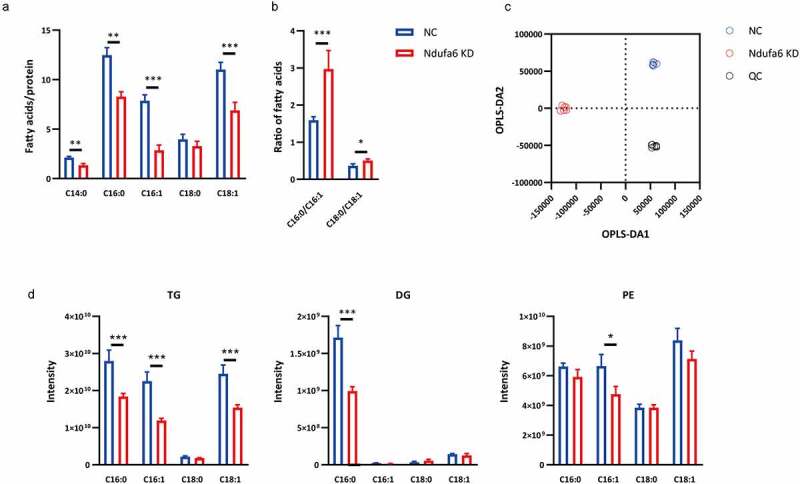
Figure 3.

Lipidomic analysis. After adipogenic differentiation, OP9 cells with (Ndufa6 KD) or without (NC) Ndufa6 knockdown were collected, and cellular fatty acids and lipidomics were performed. (a) Determination of cellular fatty acids after adipogenic differentiation by GC–MS and (b) the ratio of Scd1 product to substrate (C16:0/C16:1, C18:0/C18:1) (n = 6). (c) OPLS-DA score plot of lipids derived from OP9 cells after adipogenic differentiation. Lipidomics was performed by LC–MS in the negative ion mode and positive ion mode (n = 6). (d) Under the positive ion mode, the composition of selected fatty acids (C16:0, C16:1, C18:0 and C18:1) in lipids was determined. Statistical analysis was performed by the LSD t-test. * P < 0.05; ** P < 0.01; *** P < 0.005
