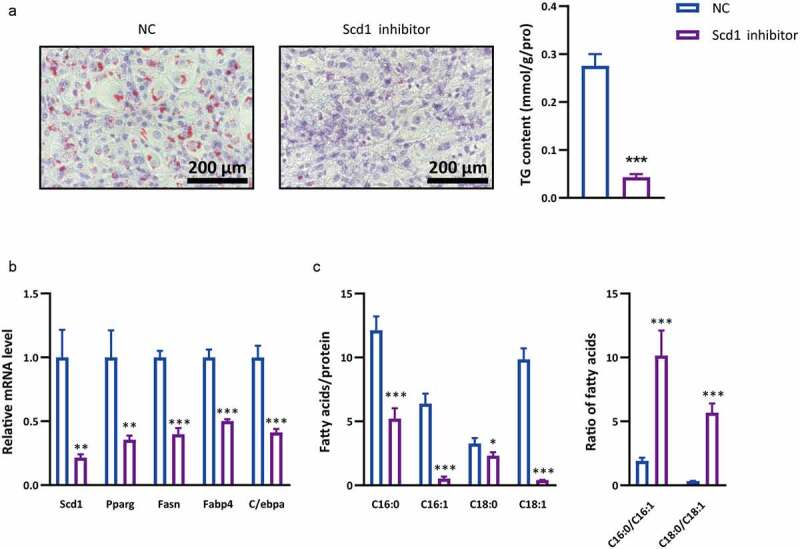
Figure 6.

Effects of Scd1 inhibitor on adipogenic differentiation. During adipogenic differentiation, OP9 cells were incubated with Scd1 inhibitor or solvent control (NC). (a) Oil red O staining was performed after adipogenic differentiation. The lipid droplets were stained red, and nuclei were stained blue by haematoxylin. The scale bar in the figure is 200 μm. The cellular TG content was tested in OP9 cells after adipogenic differentiation (n = 3), and the test results were normalized by the protein content. (b) RT–qPCR was used to test the relative mRNA level of Scd1 and other adipogenic differentiation marker genes in OP9 cells with or without Scd1 inhibitor after adipogenic differentiation (n = 3). (c) After adipogenic differentiation, the cellular fatty acids were tested, and the Scd1 product and substrate (C16:0, C16:1, C18:0 and C18:1) were analysed (n = 3). Statistical analysis was performed by the LSD t-test. * P < 0.05; ** P < 0.01; *** P < 0.005
