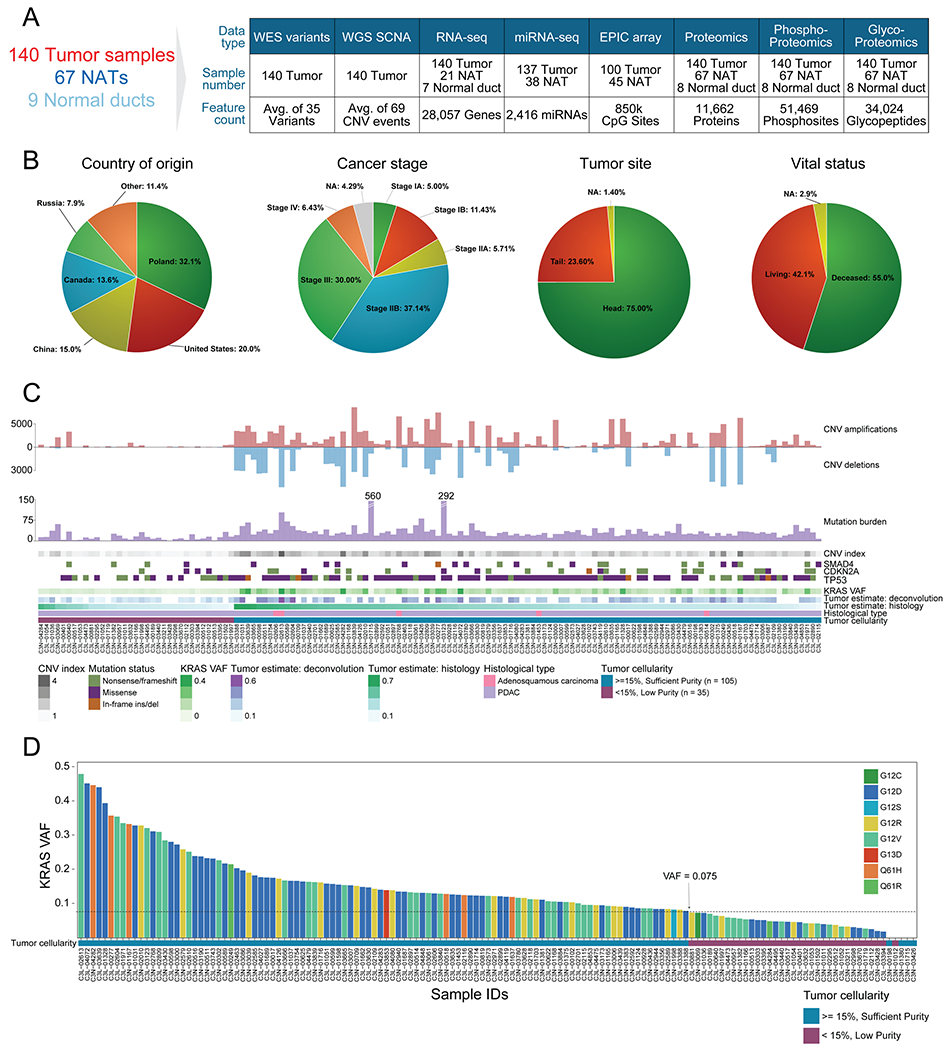
Figure 1. Proteogenomic landscape of the PDAC cohort.

A) Sample numbers and omics data types of the cohort. B) Country of origin, cancer stage, tumor site, and vital status proportions in the cohort. C) Molecular and histology-based tumor estimates are used to classify samples into “sufficient” and “low” purity groups. D) KRAS VAF distribution in the cohort colored by KRAS hotspot amino acid change. The sufficient neoplastic purity KRAS VAF cutoff, denoted by a dashed line, is 0.075 (15% neoplastic cellularity). The 4 samples with no KRAS mutations detected were also included in the sufficient tumor cellularity group since they had high mutation burden (n > 25), high CNV (index > 1), and/or additional driver events in TP53, CDKN2A, and SMAD4.
