
Figure 2. Impact of genomic alterations on the transcriptome, proteome, and phosphoproteome.
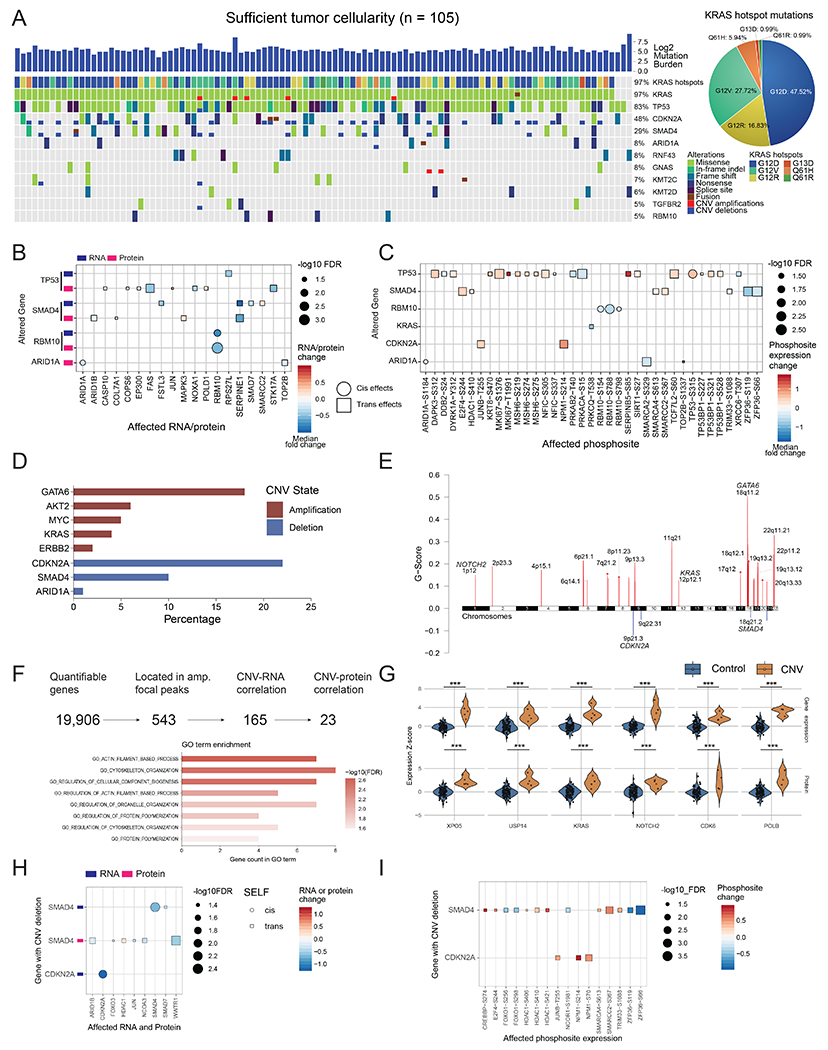
A) Genomic landscape of the cohort with sufficient tumor cellularity (n = 105) showing mutated genes with a frequency ≥0.05. All mutation types are considered, including missense, frameshift, splice-site, copy number alterations, and fusion events. G12D, G12R, and G12V are the most common KRAS driver mutations present in the cohort. B) Cis- and trans-effects of genomic alterations on RNA and protein levels. C) Cis- and trans-effects of genomic alterations on phosphosites. Protein levels are used as a covariate to remove protein abundance-related effects. In B and C, cis-effects are denoted by circles while trans-effects are denoted with squares. D) Major gene copy number amplification and deletion rates in the cohort. The log ratio cutoffs used are [−0.4, 0.4] (See STAR Methods). E) Significant arm level focal peaks detected using GISTIC. Several of these peaks contain known driver genes in PDAC such as GATA6, CDKN2A, and SMAD4. F) CNV driver approach schematic. From all genes with copy number events, 543 are located in the GISTIC focal peaks, of which 165 have RNA effects and 23 also have protein level effects. These 23 genes have roles in actin filament and cytoskeleton organization pathways. G) Violin plots showing the impact of copy number in a select number of proteins from these 23 putative CNV drivers. *** Denote p < 0.001. The control group in each comparison includes all samples without the copy number event for each gene or protein. The alterations of H) mRNA and proteins, and I) phosphosites associated with CDKN2A and SMAD4 deletions. Samples with wild-type CDKN2A and SMAD4 serve as controls.